
15 Minutes
Android Macrobenchmark: Real-World Performance Testing for Apps
Fix Bugs Faster! Log Collection Made Easy
In Android development, performance isn’t something you tack on at the end. It’s foundational. Users don’t care how elegant your architecture is if the app stutters from their first tap of the screen. Responsiveness, fluidity, launch speed; all these things don’t just influence user experience, they define it.
Saying “it works fine on my Pixel” is a nice confidence boost, but it doesn’t count as real data. And emulators don’t count either. If you’re serious about quality, you need numbers that reflect the messiness of real-world usage, background services running, low battery, CPU throttling, a sketchy network connection and the real-world stuff that actually happens outside the lab.
Table of Contents
Introduction
What unit tests don’t tell you
Writing tests is a good thing. But unit tests aren’t built for checking the actual performance of the app. They’re good for making sure your code behaves, not for catching a scroll that drops to 30 FPS on mid-range hardware. They won’t warn you when your cold start time goes from snappy to sluggish because someone added a blocking I/O call at the wrong stage.
Those kinds of problems don’t show up until the app is out in the wild, unless you’re testing for them directly.
This is where Android’s Macrobenchmark library earns its place in your toolkit. It’s designed to measure what users actually feel: cold starts, frame rates, scroll smoothness, jank, power draw, all of it.
Unlike microbenchmarks, which are hyper-focused on isolated methods, Macrobenchmark tests entire flows. Not “does this function return the right value,” but “how fast does the screen paint when the user swipes?” You get data tied to experience, not just correctness.
Microbenchmark vs. Macrobenchmark: What’s the difference?
If you’ve worked on performance before, you’ve probably come across microbenchmarks.
A microbenchmark zeroes in on a specific method or code block. Want to know how long a sorting function takes to run? That’s your tool. It’s surgical. Precise. But completely blind to the bigger picture.
Macrobenchmark, in contrast, looks at how your app behaves when users actually interact with it. It deals with the system-level stuff you can’t fake in isolation:
- Cold start time – how long it takes to launch from a cold state
- Frame rendering – how smooth scrolling and transitions feel
- Lifecycle transitions – how quickly the app recovers when resumed from the background
One’s about measuring code. The other’s about measuring experience.
Use Microbenchmarks when you’re fine-tuning a function. Use Macrobenchmarks when you want to know how the app holds up under real conditions.
Understanding Android Macrobenchmark
Definition and core concepts
Macrobenchmark is a Jetpack library for testing how your app performs during full user flows, startup, scrolling, transitions, or anything you can simulate through the UI. It runs on real devices or emulators, and it aims to replicate actual user behavior.
Core APIs of Macrobenchmarks
MacrobenchmarkRule
JUnit rule mainly wraps your test logic, and it handles lifecycle, manages the device, and collects metrics.
@get:Rule
val benchmarkRule = MacrobenchmarkRule()
measureRepeated
This is where the test logic lives. You define setup and execution blocks, and the rule runs them multiple times to collect statistically valid results.
benchmarkRule.measureRepeated(
    iterations = 10,
    setupBlock = {
        pressHome()
    },
    measureBlock = {
        startActivityAndWait()
    }
)
Startup modes:
Control how “fresh” your app starts:
StartupMode.COLD: App process is killed before each launchStartupMode.WARM: Process alive, activity in backgroundStartupMode.HOT: Everything in memory, ready to resume
Compilation modes:
They simulate real-world performance based on how the app was installed:
CompilationMode.None(): Worst-case, no JIT/AOT helpSpeedProfile(): Uses ART’s profile-guided optimizationsBaselineProfile(): Uses your own predefined performance profile
Metrics we can track:
StartupTimingMetric(): Time to first frame; time to fully drawnFrameTimingMetric(): UI jank and rendering timesCpuMetric(): CPU load during the testMemoryMetric(): Allocation and memory usagePowerMetric(): Battery impact of the operation
Macrobenchmark isn’t just about measuring performance, it’s about catching real user pain points before they land in production.
2. Macrobenchmark vs. traditional performance testing approaches
Macrobenchmark is built to test real-world usage patterns. Not isolated functions, but for the full flows. Cold starts, login screens, heavy scroll lists. It runs on physical devices or emulators and simulates how users actually interact with your app.
This gives you performance metrics that match user perception: launch speed, UI jank, frame stability, the stuff they’ll notice and you’ll hear about in one-star reviews.
Now contrast that with traditional tools like Android Studio Profiler and Systrace. These are diagnostic tools. They’re ideal for drilling deep into system-level behavior, thread scheduling, memory spikes, GC pressure, and so on. But they’re not automated, not easy to scale, and definitely not ideal for repeatable, end-to-end performance validation in CI.
Key differences in practice
- Scope: Macrobenchmark tests full user journeys: launch, interact and navigate. Profilers zoom in on narrow slices: a thread, a method, a view hierarchy.
- Automation: Macrobenchmark tests are just JUnit. Run them locally or in CI without touching a profiler UI. Profilers are mostly manual and session-based.
- Realism: Macrobenchmark behaves like a user would. It launches the app, taps buttons, scrolls lists. Profiler sessions are more like a deep dive, precise, but not reflective of day-to-day usage.
- Metrics: Macrobenchmark gives you high-level metrics:
- App startup time
- Frame rendering performance
- CPU, memory, power usage
3. Key metrics measured by Macrobenchmark
Macrobenchmark includes a set of high-level metrics designed to surface performance issues that affect real users.
- StartupTimingMetric: Measures how long the app takes to start. It captures both
timeToInitialDisplayMs(when the first frame shows up) andtimeToFullDisplayMs(when everything is fully drawn and ready). It is useful for spotting slow cold starts. - FrameTimingMetric: Tracks frame durations and flags dropped or delayed frames. If your app stutters during scrolls or transitions, this is the metric that’ll show it.
- CpuMetric: Monitors how much CPU your app consumes during the test. This is good to identify the CPU’s heavy operations and the heavy tasks running in the background.
- MemoryMetric: This metric monitors memory allocation and its usage. This is good to catch the memory leaks and the functions which are responsible to spike RAM usage.
- PowerMetric: Estimates energy drain during the test. Important for apps where battery life matters.
All of these metrics are captured inside the measureBlock of your benchmark. The idea is to turn performance into something you can actually track and fix, not just guess at.
Step-by-step Macrobenchmark setup
1. Dependencies
Add this to your benchmark module’s build.gradle:
androidTestImplementation "androidx.benchmark:benchmark-macro-junit4:1.2.0"
Make sure you’re using the Google Maven repo. Enable self-instrumenting builds in gradle.properties:
android.experimental.self-instrumenting=true
This lets the benchmark module measure its own execution without extra instrumentation layers.
2. Project structure
Create a separate module just for benchmarking:
- Use the
com.android.testplugin - Target your main app module
- Only include test code, no app logic here
Android Studio can scaffold this for you:
File > New > New Module > Benchmark > Macrobenchmark
Set min SDK to 23 or higher and target your main app module during setup.
3. Gradle config
Your build.gradle for the benchmark module should look like this:
plugins {
    id 'com.android.test'
    id 'kotlin-android'
}

android {
    compileSdkVersion 33

    defaultConfig {
        minSdk 23
        targetSdk 33
        testInstrumentationRunner "androidx.test.runner.AndroidJUnitRunner"
    }

    buildTypes {
        release {
            signingConfig signingConfigs.debug
            matchingFallbacks = ['release']
            debuggable false
        }
    }

    targetProjectPath ':app'
}
4. Create a benchmark build type
Inside your app module, add a benchmark build type:
android {
    buildTypes {
        benchmark {
            initWith release
            signingConfig signingConfigs.debug
            debuggable false
        }
    }
}
5. Permissions and device settings
If you want to capture metrics on Android’s multiple devices, your app needs to be profileable. In AndroidManifest.xml, set:
<application
    android:profileable="true"
    tools:targetApi="29" />
On your test device, make sure:
- Developer options are on
- USB debugging is enabled
- “Stay awake” is optional, but helpful for long tests
If your test needs permissions, use GrantPermissionRule:
@get:Rule
val permissionRule: GrantPermissionRule = GrantPermissionRule.grant(
    Manifest.permission.READ_EXTERNAL_STORAGE
)
Steps to create the Macrobenchmark
1. Basic setup
Start by creating a test class and using MacrobenchmarkRule:
@RunWith(AndroidJUnit4::class)
class StartupBenchmark {

    @get:Rule
    val benchmarkRule = MacrobenchmarkRule()

    @Test
    fun coldStartup() = benchmarkRule.measureRepeated(
        packageName = "com.example.app",
        metrics = listOf(StartupTimingMetric()),
        iterations = 5,
        startupMode = StartupMode.COLD,
        setupBlock = { pressHome() },
        measureBlock = { startActivityAndWait() }
    )
}
//This runs a cold start test 5 times and measures startup timing.
2. Key parameters
measureRepeated supports several useful options:
metrics: Pick fromStartupTimingMetric,FrameTimingMetric,CpuMetric, etc.iterations: Number of times the test runs, the more runs = better data.startupMode: UseCOLD,WARM, orHOTto simulate different launch states.compilationMode: Set toNone,SpeedProfile, orBaselineProfile.setupBlock&measureBlock: Prep and run the actual interaction you’re testing.
3. Startup modes
- Cold: App isn’t running at all, it’s the cleanest test of full launch.
- Warm: App process is alive, but not foregrounded.
- Hot: App and activity are still in memory.
Switch modes using startupMode = StartupMode.COLD.
4. Measuring UI performance
To check scroll smoothness, use FrameTimingMetric:
@Test
fun scrollTest() = benchmarkRule.measureRepeated(
    packageName = "com.example.app",
    metrics = listOf(FrameTimingMetric()),
    iterations = 5,
    setupBlock = { startActivityAndWait() },
    measureBlock = {
        val recycler = device.findObject(By.res("com.example.app:id/recycler_view"))
        recycler.fling(Direction.DOWN)
    }
)
//This helps identify jank and rendering issues during scroll.
5. Simulating scroll flows
For longer or repeated scrolling:
//Runs a full scroll loop and tracks frame drops across the flow.
measureBlock = {
    val recycler = device.findObject(By.res(packageName, "recycler_view"))
    for (i in 1..10) {
        recycler.scroll(Direction.DOWN, 2.0f)
        device.waitForIdle()
    }
}
6. Testing user interactions
Simulate full user journeys:
//login flows
measureBlock = {
    device.findObject(By.text("Login")).click()
    device.findObject(By.res("com.example.app:id/username")).text = "user"
    device.findObject(By.res("com.example.app:id/password")).text = "pass"
    device.findObject(By.text("Submit")).click()
}
This is useful when you want to track how performance holds across multiple UI steps.
Advanced benchmark techniques
1. Custom metrics and trace points
Macrobenchmark includes the best built-in metrics StartupTimingMetric and FrameTimingMetric, but if you still need something that is app specific, you have flexibility to define your own metrics by implementing the Metric interface.
We can use the Tracing API and TraceSectionMetric for targeted performance metrics. This lets you measure only the parts of your code that matter.
In your benchmark:
metrics = listOf(TraceSectionMetric("CustomSection"))
In your app code:
Trace.beginSection("CustomSection")
// logic to measure
Trace.endSection()
This combo helps you zero in on bottlenecks in critical paths without measuring the whole activity.
2. Compilation modes
Macrobenchmark lets you simulate different compilation scenarios to reflect real-world installs:
None(): Worst-case, no AOT optimizationSpeedProfile(): Optimizes based on user behavior over timeBaselineProfile(): Uses a custom profile for fast cold starts
You can loop through all modes in a single test to compare impact:
val modes = listOf(
    CompilationMode.None(),
    CompilationMode.SpeedProfile(),
    CompilationMode.Partial(BaselineProfileMode.Require)
)
Switching modes helps catch regressions that only show up after install or on fresh devices.
3. Setting up Baseline Profiles
To speed up startup from the first launch, generate and apply a Baseline Profile:
- Create a separate profile module
- Simulate key user flows using
BaselineProfileRule:
@get:Rule
val baselineProfileRule = BaselineProfileRule()

@Test
fun generateProfile() = baselineProfileRule.collect(
    packageName = "com.myApp.app"
) {
    startActivityAndWait()
    // Interact with the app here
}
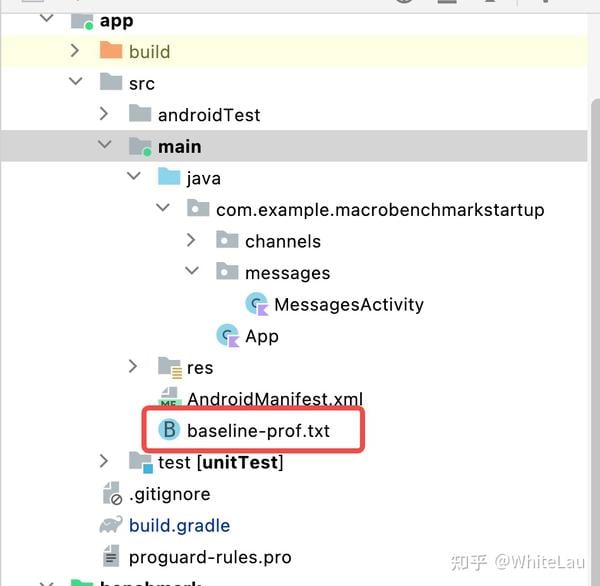
- Run the test on a real device to generate
baseline-prof.txt - Add it to your app in
src/main/baselineProfiles/and declare it inbuild.gradle
4. Measuring the resource usage
If your app’s performance issues are tied to CPU, memory, or battery use, Macrobenchmark has metrics for that too:
CpuMetric(): Track how much processing power is usedMemoryMetric(): Monitor memory allocations and spikesPowerMetric(): Estimate battery drain during interactions
//Example: Scroll test tracking CPU and memory:
metrics = listOf(CpuMetric(), MemoryMetric())
This is good for catching background tasks that eat up resources during user interactions.
5. Parameterized Performance Tests
If you need to test how scroll performance scales with content size, use parameterized benchmarks.
@Parameterized.Parameters
fun data() = listOf(50, 100, 200)
Pass that data into your test setup, launch the list with ITEM_COUNT, and measure performance accordingly.
Optimizing with Baseline Profiles
Baseline Profiles give you control over what gets compiled ahead of time, so your app launches faster and runs smoother from the very first start. When combined with Macrobenchmark, they let you pinpoint real bottlenecks, generate accurate profiles based on real user flows, and optimize performance where it actually matters.
Generating and Applying Baseline Profiles
1. Create the Profile Generator module
If you’re using Android Studio Iguana or AGP 8.2+, there’s a built-in template for this:
- Go to File > New > New Module
- Choose Baseline Profile Generator
- Select your target app module, set up the package and name, and finish
This sets up a separate module with the right dependencies, test classes, and Gradle config to generate baseline profiles.
2. Define real user flows
In the generated test class, use BaselineProfileRule to simulate actual user behavior like startup, navigation, or anything you want optimized.
@get:Rule
val baselineProfileRule = BaselineProfileRule()

@Test
fun generateProfile() = baselineProfileRule.collect(
    packageName = "com.myapp.app"
) {
    startActivityAndWait()
    // Simulate key user interactions here
}
3. Generate the profile
Run the test on a real device or emulator. The profile gets saved as baseline-prof.txt under your test output directory.
4. Wire It into Your App
Add the profile module as a dependency:
dependencies {
    baselineProfile project(":baseline-profile")
}
Then, drop baseline-prof.txt into src/main/baselineProfiles/ in your app module.
When your app installs, ART will pick it up and compile those paths ahead of time.
Continuous integration with Macrobenchmark
Automating benchmark runs
You can wire Macrobenchmark into CI using:
- Gradle tasks to build app and benchmark APKs
- Instrumentation runner to execute tests
- Firebase Test Lab for running on physical devices
Regression detection
To catch regressions:
- Set performance thresholds
- Compare results against previous runs
- Store historical results
- Visualize trends with Google Cloud Monitoring
- Trigger alerts (email) when thresholds are crossed
Real-World case studies
1) Boosting startup with Baseline Profiles
The Android Calendar team used Baseline Profiles to speed up cold launches. By targeting actual user flows, they cut startup time by around 20% and halved the number of slow or frozen frames.
Takeaways for you:
- Baseline Profiles performs at its best when used with real user journeys, not just the synthetic user flows.
- Startup gains are measurable and very impactful.
2) Fixing UI Jank with Frame Metrics
Smooth UIs aren’t just about layout, they’re about timing. Using FrameTimingMetric, teams have been able to flag missed frame deadlines, locate bottlenecks in transitions or scrolls, and smooth out the user experience without guessing.
Tips for you:
- Capture the frame timings regularly, even if small UI hiccups show up in the numbers.
- Don’t guess where the jank is, instead use traces and metrics to find it fast.
3) Cleaning up startup bottlenecks
Heavy operations during launch are a common startup killer. In several internal and open-source projects, teams found the main thread blocked by resource loading, unnecessary database calls or slow third-party SDKs.
Best practices and common pitfalls
Keep the environment clean
You can’t trust your results if your test setup is noisy. For reliable benchmarks:
- Use physical devices: Emulators won’t give you consistent, real-world data.
- Kill all background services: Anything running outside your app adds noise.
- Lock the device state: Keep the brightness, network and battery levels consistent.
Mind the hardware and the heat
Device behavior changes with heat and hardware.
- Test on multiple devices: Performance on a Pixel 8 isn’t the same as on a low-end Android One phone.
- Watch for thermal throttling: Long sessions heat up the CPU and mess with results.
- Add cooldown time: Space out runs to let devices recover between iterations.
Configure iterations properly
Single runs are never enough. You need good data:
- Run multiple iterations: Five is the bare minimum, ten is safer.
- Warm up first: Discard the first few runs, they’re often slower and unrepresentative.
Avoid these common traps
- Skipping warm-ups: You’re not testing cold-start logic here unless that’s the goal. Warm up the system.
- Ignoring result variance: Averages without distributions are misleading. Check spread, not just mean.
Conclusion
Macrobenchmark is not just the performance tool, it’s a reality check. Macrobenchmark forces you to test your app the way real people use it, including cold starts, scroll-heavy screens and touch interactions, all happening on real hardware.
Macrobenchmark exposes the difference between code that passes tests and code that actually performs. When Macrobenchmark is paired with Baseline Profiles and integrated into CI, it gives us a complete solution to measure, optimize and validate the application. If you care about how your app actually performs in users’ hands, Macrobenchmark should be part of your workflow.
Macrobenchmark gives you real, measurable data like startup time, frame smoothness, CPU usage and memory pressure. When it is paired with Baseline Profiles, it pushes critical code paths through AOT compilation so your app feels fast from the first launch.
In this article we also discussed the implementation of Macrobenchmark into CI, to give you performance monitoring baked into your pipeline, to ensure no surprises slipping through.
Just make sure you’re benchmarking in a clean, controlled environment. Account for device variance, manage heat and run enough iterations, and stay consistent. Don’t treat this as a one-off task.
We discussed the advance features of Macrobenchmark, including Custom Metrics. We also learned optimization tips and best practices for using Macrobenchmark in your project.
Build fast. Stay fast. Happy Coding!
Expect The Unexpected!
Debug Faster With Bugfender

Sachin Siwal
Sachin is an accomplished iOS developer and seasoned technical manager, combining 12 years of mobile app expertise with a knack for leading and delivering innovative solutions. You can contact him on Linkedin