JavaScript console.log() method and advanced JavaScript console logging techniques are crucial resources in modern web development. These tools have been an important turning point for the adoption of Agile’s fast release cycles that has powered the flood of software innovation over the past 20 years. Without the concept of releasing fast, taking feedback and building back better the world would be a slower, duller place without it.
This fast release cycles wouldn’t be possible without the developer tools published by Safari, Chrome and other browsers. These tools show us how our app behaves out in the wild, and enable developers to debug and fix on the fly without deep dives into the source code.
Of all the many possibilities offered by dev tools, the JavaScript Console tool, which helps developers to log messages, is arguably the most important. And in this article, we’ll break into several exciting use-cases for the JavaScript Console tool, including advanced usages to help you make decisions, analyze data and write code snippets before changing the source code.
First, let’s find the Console Tool using the developer tools shortcut
Simply open your favourite browser and press the F12 on your keyboard (if you’re on a Mac, you’ll need /fn + F12).
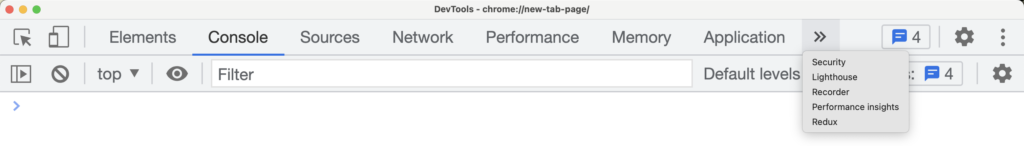
This should open the Developer Tools interface. Once you’ve found the Console tab, you can get started.
The Console tab of the Google Chrome Developer Tools.
Ok, on to the basics of console logging
JavaScript is the universal language of web applications, and you can use the Console web API to log messages into the browser’s console.
Here are some JavaScript code examples:
console.log: The log() console method outputs a message to the browser’s console (in the Console tab).
console.info: If you want to log any informational message, you can use the info() method. Firefox will show a small “i” icon beside the message, to indicate it is an information message.
console.warn: The warn() method logs a warning message. This will be in a distinctive colour, so you can find the message quickly. The Chrome and Firefox browsers will also show an exclamation point icon beside the message to indicate the warning.
console.error: The error() method logs an error message into the console. This time the message will be in red.
console.debug: To output a message at the debug log level, you can use the debug() method. Please note you will not be able to see the debug messages if the console is configured to hide the debug messages.
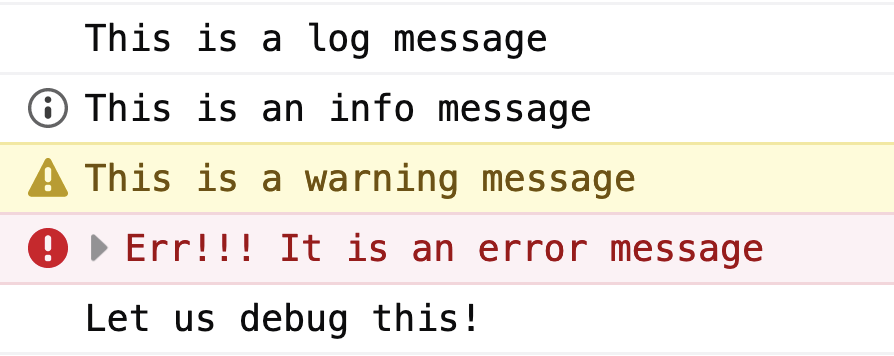
console.log('This is a log message');
console.info('This is an info message');
console.warn('This is a warning message');
console.error('Err!!! It is an error message');
console.debug('Let us debug this!');
The console output (in the Firefox browser)
The console output of the various logging methods on the Firefox browser.
Remember: you need to know what you’re logging
When you log into the console, you may only be interested in logging the values. No worries: we get that. You want to get the information as quickly as possible.
But without context, you may struggle to understand where the value comes from and what it relates to. For example, the following code has been created to log a user’s name, and will output atapas.
const userName = 'atapas';

console.log(userName);
But if you see the log statement and don’t see the code that’s produced it, you will likely be clueless about what atapas actually is.
Well fear not, because you can fix this problem in two ways.
First, you can pass a relevant message, and the value, as comma-separated arguments to the log() method. This will output a concatenated message (in other words, a series of words linked together), which may look much better than simply logging the value.
console.log('The user name is', userName);
The output will be The user name is atapas.
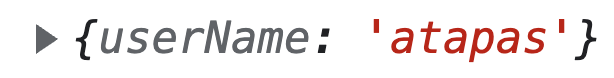
Alternatively, you can wrap the variable in the curly brackets and pass it to the log() method. This will output a JavaScript object, with the key as the variable name and the value in a console message. Personally, I prefer this approach over the previous one, but each to their own.
console.log({userName});
The Output:
Here you clearly know that ‘atapas’ is a username.
Filtering the log messages
When there are too many log messages, it’s worth filtering them to find the specific ones you are interested in. The message-filtering options differ from one browser to another, but they all do a similar job. You can filter log messages by typing the text into the filter text box from the console window. The log messages will filter based on the matching text as you type. In the image below, we’ve filtered messages matching the text status code.
Filter messages using free-flow texts.
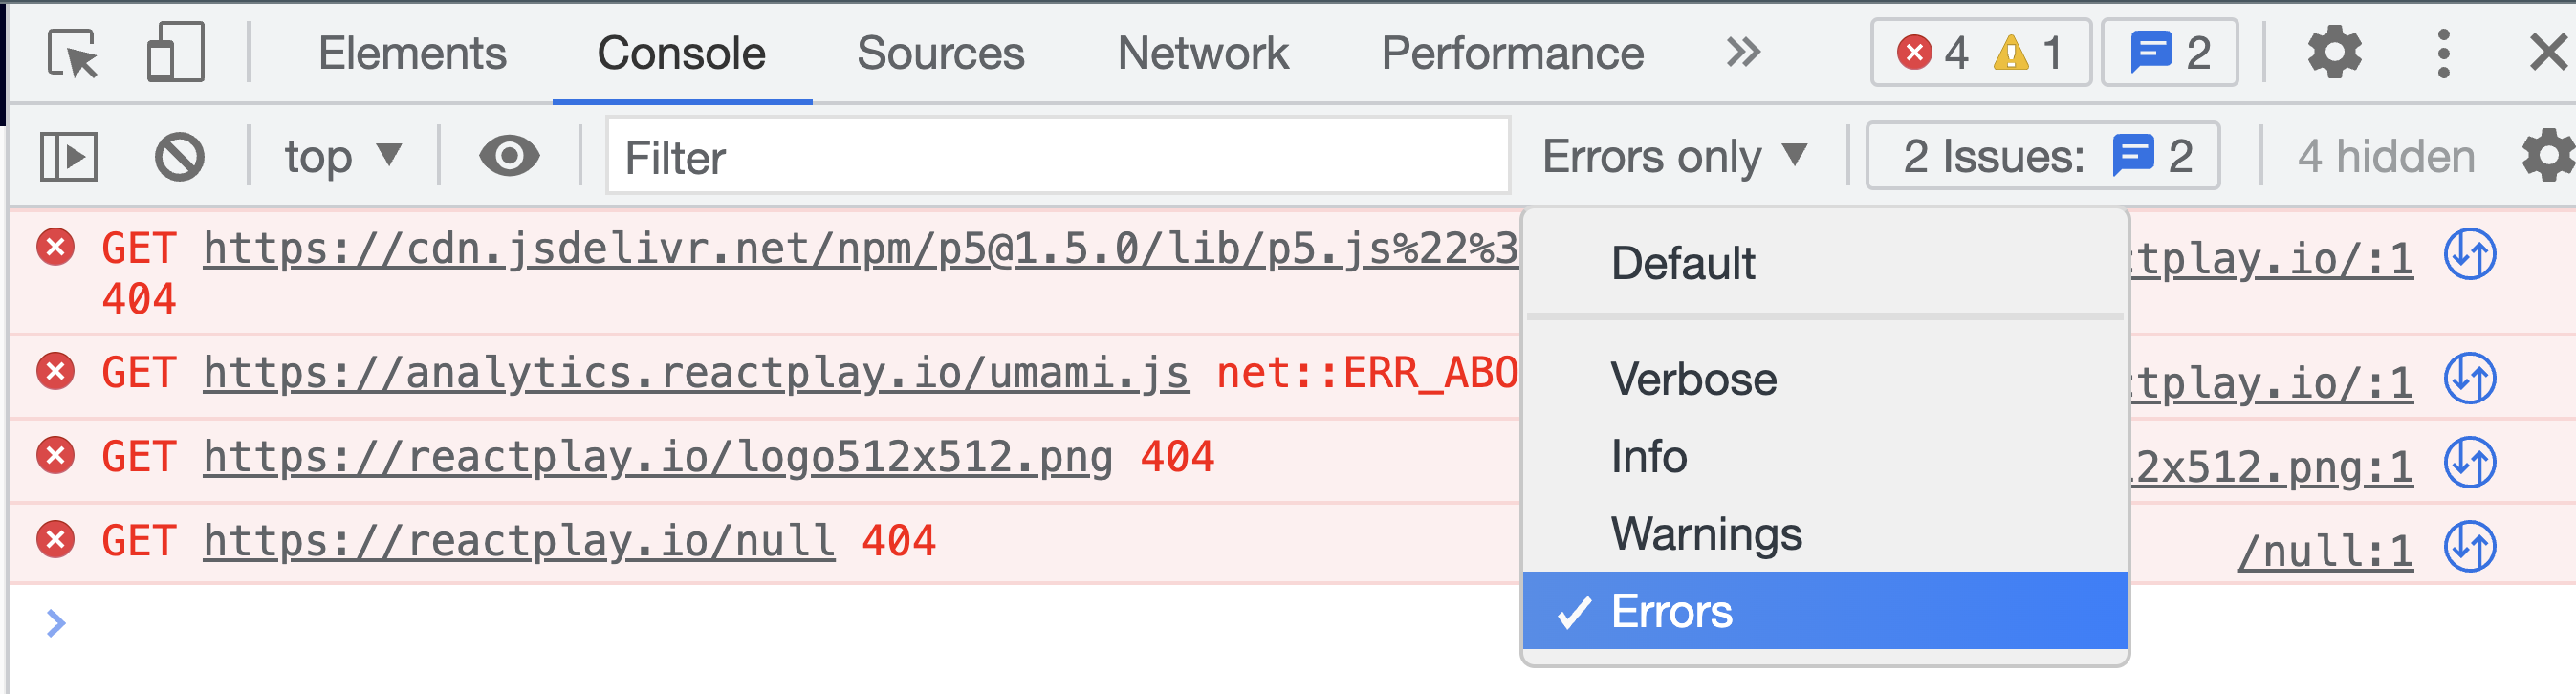
You can also filter the messages by logging level using the drop-down in the console tab.
Select one or more log levels to filter the messages.
Grouping console messages
Keeping the console log messages loose may be confusing when debugging an issue. As an alternative, you can group the log messages contextually so that they appear together.
The JavaScript console API provides two ways of doing this:
console.group: The group() method creates an inline group of the console messages. All subsequent messages to the group() method will be intended by a level until you call the groupEnd() method.
console.groupEnd: The groupEnd() method helps order the current group of messages.
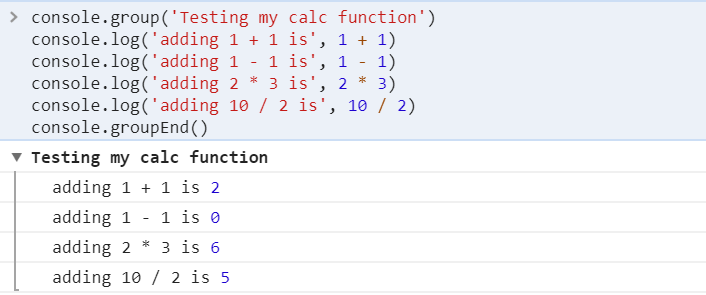
In the example below, we have grouped a whole bunch of logs together:
Please note that you can create as many groups as you want. But remember to provide a unique contextual message to the console.group() method for every group, so you can identify them without confusion.
You can also use the console.groupCollapsed() method to create a group, but in this case, the newly created group will be collapsed by default.
Tracing console messages
The console.trace() method logs a stack trace in the console. To maximise the benefits of this function, it is useful to find the path of function calls that are executed to reach the place of the console.trace() method call.
In the following code snippet, we have a trace inside the inner() function, defined and invoked inside the outer() function.
function outer() {
  function inner() {
    console.trace();
  }
  inner();
}

outer();
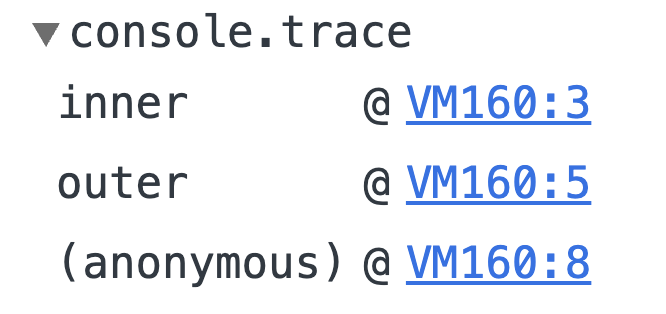
Which gives a rather nice pay-off: we can see a complete stack trace of the function calls.
A stack trace is logged with all the function invocation traces.
Displaying console messages as table
You can log complex data structures as tabular data into the console. When doing so, use the console.table() method to represent complex JSON data in the row-column fashion.
The table() method shows the user’s data in a table format.
The table() method shows the user’s data in a table format.
By default, the table() method will display all elements in the rows. You can restrict this display with the help of an optional columns parameter.
// Will show only the value of "name" attributes in each row
console.table(users, ["name"]);
Console expressions
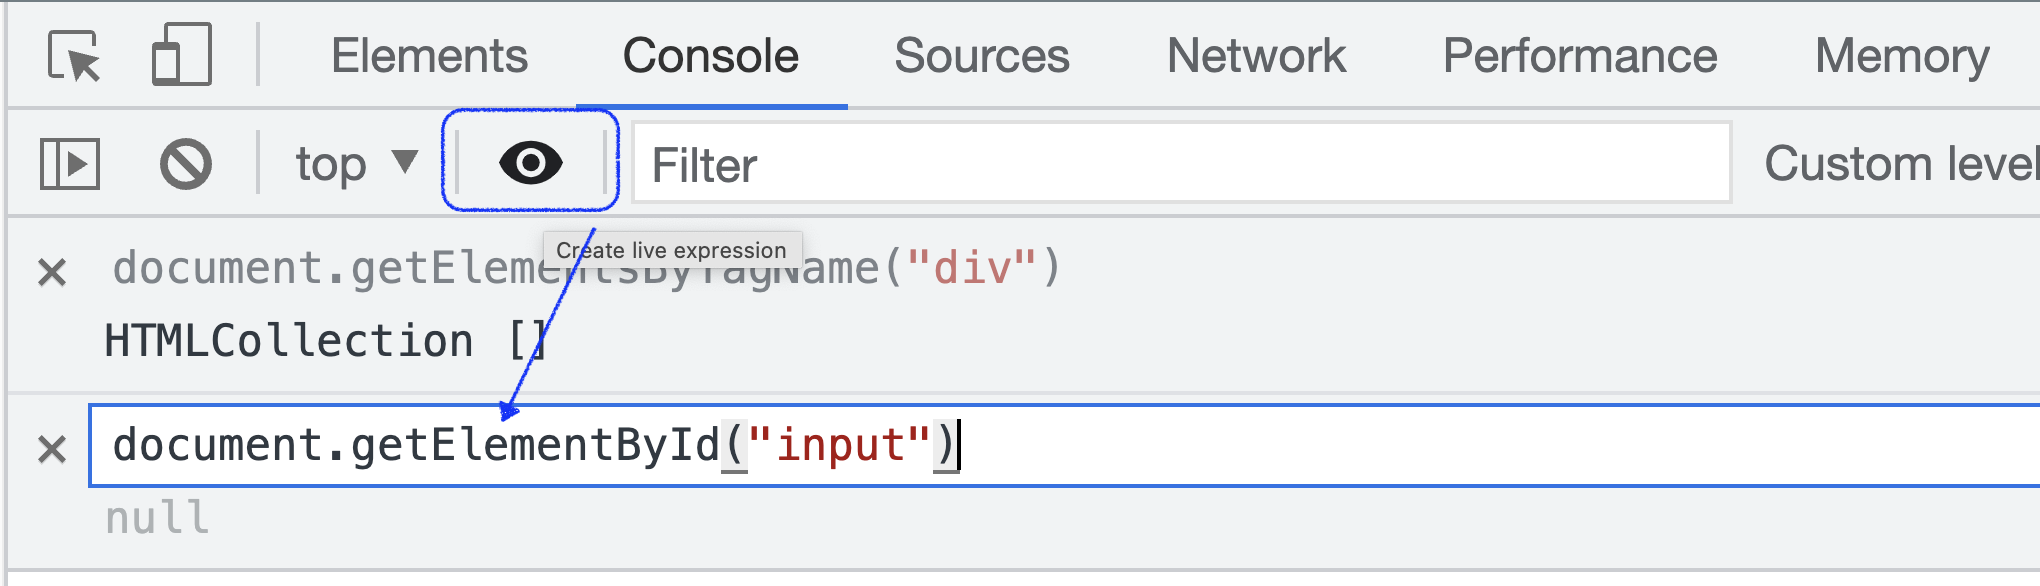
At times you may have to use a JavaScript expression repeatedly in the console. This might seem a bit time-consuming, but you can pin one or more expressions at the top of your console to make it easier. The expression value gets updated in real time.
To create an expression, simply open the console tab and click on the ‘eye’ icon. A text box will open for you to type in the expression. Then press the Enter key to save it.
The Expression Builder – You can pin expressions
Formatting console log messages
If you want, you can go a bit funky with the log message formatting and styling in the browser console.
The console supports the application of multiple format specifiers using substitution strings. In the table below, you can see the ones that are supported now.
Specifier
Description
%s
Format a variable as a string
%d
Format a variable as an integer
%f
Format a variable as a floating-point number
%o
It can be used to print a DOM Element
%0
Used to print an object representation
%c
Used to pass CSS to format a string
Let’s look at a quick example: In the code snippet below, we’re formatting a message with string and integer values. We are also passing CSS format to style the message.
console.log(
  '%c I have %d %s',
  'color: green; background:black; font-size: 20pt',
  3,
  'Bikes!'
)
And here’s the output:
Preserving console log messages
If you lost your log messages every time you navigated to the new pages of your application, it would be a serious hassle – not to mention a distraction as you attempt to hone, tweak and polish your app.
But there’s an easy way to preserve them. Simply click on the gear icon to open the settings panel. In the settings panel, you will find a setting called Preserve log. Click on the checkbox in front of it to enable the setting.
Turn on the setting to preserve the logs between renders.
Console time
Time is one of the most decisive factors in the success or failure of an application: our users expect lightning, and they’ll turn their backs if we don’t deliver.
Thankfully, the browser console can help us measure the execution time of each function before we embed it into our source code file. In fact, the JavaScript console API provides two important time-related methods:
console.time: The time() method starts a timer for you and runs it until you call the timeEnd() method. The time() method takes a unique name as an argument to identify the timer to end it.
console.timeEnd: The timeEnd() method… well… it does exactly what it’s name would suggest.
Here’s an example where we calculate the time to retrieve the last name value a billion times.
function test time() {
  var users= [
    {
      firstname: "Tapas",
      lastname: "Adhikary",
      hobby: "Blogging"
    },
    {
      firstname: "David",
      lastname: "Williams",
      hobby: "Chess"
    },
    {
      firstname: "Brad",
      lastname: "Crets",
      hobby: "Swimming"
    },
    {
      firstname: "James",
      lastname: "Bond",
      hobby: "Spying"
    },
    {
      firstname: "Steve",
      lastname: "S",
      hobby: "Talking"
    }
  ];

  var getName = function (user) {
    return user.lastname;
  }

  // Start the time which will be bound to the string 'loopTime'
  console.time("loopTime");

  for (let counter = 0; counter < 1000 * 1000 * 1000; counter++) {
    getName(users[counter & 4]);
  }

  // End the time tick for 'loopTime
  console.timeEnd("loopTime");
}
The output:
loopTime: 2234.032958984375ms
Store As global variable
In real-world programming, we deal with a bigger chunk of JSON objects as the response of API calls, and we might want to pick a tiny portion for granular analysis and improvement.
The console tool allows us to save any portion of the JSON object as a Global Temporary Variable. You can use this variable later in the console panel for computations.
Check out the example below. Note that we’re saving the users array as a temporary variable and using it further.
A handy way to deal with the massive JSON response
Multi-Line console messages
Sometimes you may find it annoying to type multi-line expressions in the console panel, particularly when you’re in a sprint or working to a tight deadline.
To enter multiple lines in the console panel, press shift and enter key combinations at the end of a line to continue with the execution of each line. Finally, you can press the enter key to complete the process.
Multi-Line expressions in the console panel.
Displaying an interactive list of object properties
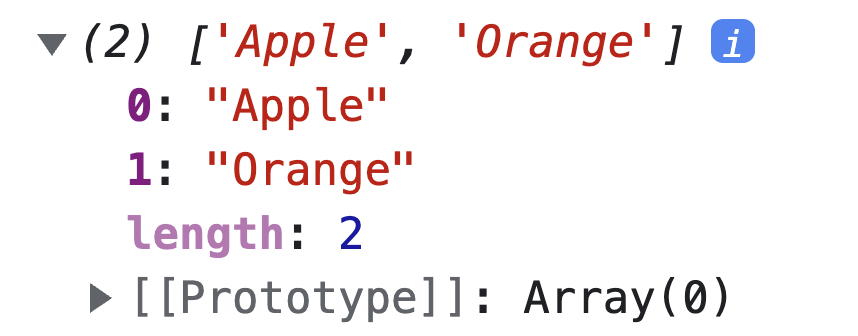
You can use the console.dir() method to display an interactive list of object properties. In some browsers like Google Chrome, the console.log() method also prints objects and arrays as interactive lists, but it doesn’t show their type until you expand the output.
console.log(['Apple', 'Orange']);
The output:
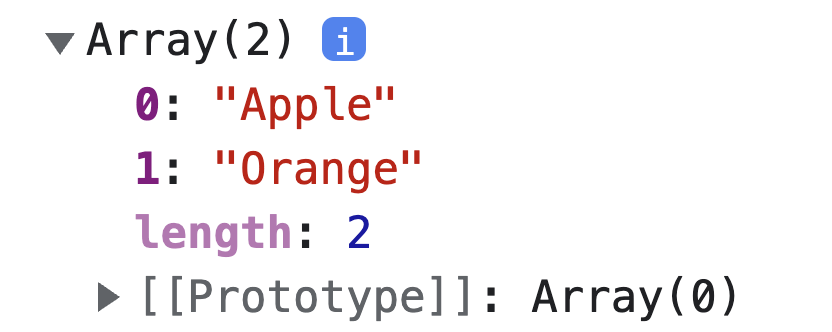
Now try the console.dir() method instead.
console.dir(['Apple', 'Orange']);
Check the output below, showing that the displayed message is an array of two elements. Now, when you expand it, you get to see the elements.
Arrays can be one of the most important data structures in any programming language, learn how take your JavaScript arrays knowledge to the next level with the following article.
The console tool has several utility APIs to select, inspect, and monitor DOM. Note that you can only run these utility commands from the dev tools console panel: you can’t run them with external scripts.
$0: Reference a node
The $0 utility command returns the recently selected node in the Elements panel, so that you can refer to it and perform further debugging and computations.
Check out the example below. It shows how we select and use a DOM element from the Elements panel in the Console panel.
$0 command to reference the latest node.
$_: Refer to previous execution output
The $_ utility command returns the value of the expression you executed recently. Take a look at the image below to understand how to use the command in the console.
$0 command to reference the latest node.
$_ command to refer to previous execution output
$: Query selector
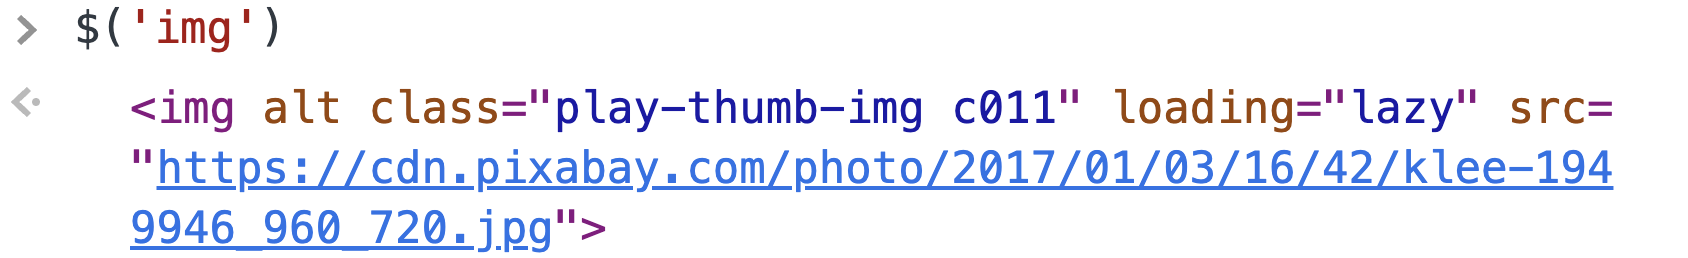
The $ utility command works like document.querySelector(), returning the reference to the first DOM element with the specified CSS selector.
The example below shows the usage of the $ command to select the first image DOM element.
$ command works as a query selector
$$: Query selector all
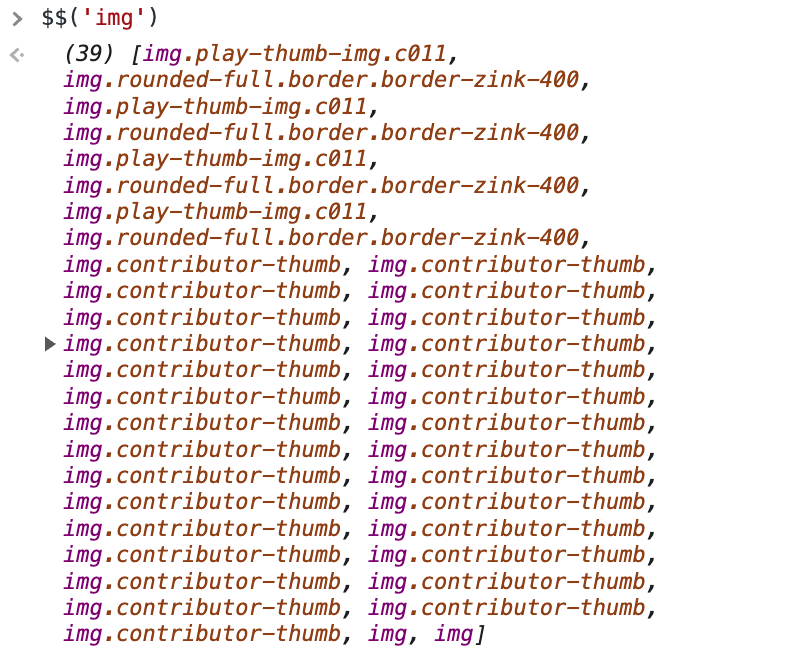
The $$ utility command works like document.querySelectorAll() to return an array of elements that match the specified CSS selector. The example below shows the usage of the $$ command to select all the DOM element that represents images.
$$ command selects query selector for all matching tags
clear() method
The clear() method will clear the console.
And finally: getting logs From Your customers
When discussing JavaScript logging console in this article, we’ve focused on instances where console logs can be used to debug and troubleshoot issues on the physical device itself.
However, our users may be spread all over the world, so it’s important to have tools that can provide insight into the performance of an application on remote devices as well.
This is where Bugfender comes in.
Bugfender enables developers to gather console logs from customer devices remotely, so we get a comprehensive view of an application’s performance and troubleshoot problems even when the user is in a different continent. With Bugfender you will have a JavaScript online console where you can get all the information that your app is logging to console.
Bugfender is available as a Javascript package you can integrate in your Javascript application, with integrations with multiple frameworks. Here are some examples:
The JavaScript Console Web API provides a function called console.log that allows developers to print JavaScript messages, variables, errors, and other data to the browser’s console. It’s a very useful tool for troubleshooting and monitoring web application behavior and errors.
How do you use console log in JavaScript?
To use the console log in JavaScript, simply call the console.log() method, followed by the object or message to be logged. Console.log("Hello, World!"); will, for example, print "Hello, World!" in the browser’s JavaScript console.
How do I access console logs?
To access JavaScript console logs, launch your web browser’s developer tools, which are typically accessed by right-clicking on a webpage and selecting “Inspect” or “Inspect Element.” Navigate to the “Console” tab after the developer tools are open and there you will see all your web app messages.
What are the different types of console logging methods in JavaScript?
The most common logging in JavaScript is console.log(). Other logging methods available include console.warn(), console.error(), console.info(), console.debug(), and console.trace(). Each method serves a distinct purpose and shows messages in the console in a variety of forms and colors.
Can I style my console messages?
Yes, the JavaScript console supports CSS-based message formatting and styling. You can change the appearance of your console log messages by supplying format specifiers and CSS styles as arguments to console.log().
What is the use of console.table() in JavaScript?
The console.table() method allows developers to display complex data structures, like arrays or objects, in a tabular format in the console. This method provides a clearer view of the data, especially when dealing with large datasets.
How can I filter and group console messages for better clarity?
To group relevant messages together, use the console.group() and console.groupEnd() methods. Additionally, under the console tab, browsers include filtering options, allowing you to search and filter messages by text or log level.
Can I obtain logs from my users in order to resolve bugs?
Not directly, however you can remotely retrieve logs from users’ devices and view them on a centralized online console using technologies like Bugfender. This tool improves debugging and helps in understanding real-world application behavior, allowing developers to fix bug faster.
How does Bugfender enhance the capabilities of JavaScript logging console?
While JavaScript console logging provides insight into application activity in a developer’s environment, Bugfender captures logs from real users’ devices. This enables developers to understand issues that may not be visible in their testing environment, providing an easier JavaScript debugging experience and a more thorough perspective of program performance, helping developers to fix bugs that otherwise might be difficult to find and fix.
What purpose does console.trace() play in JavaScript debugging?
The console.trace() method outputs a stack trace to the console, displaying the sequence of JavaScript function calls used to get the user to the current position within the code. It helps to understand the flow of code and function calls, which is very useful for debugging complex JavaScript applications.
How do I handle JavaScript errors and exceptions in my live applications?
A Real-time error monitoring tool is essential for addressing JavaScript failures and exceptions in live applications. Bugfender is a fantastic tool for this. It not only continuously captures console logs, errors, and JavaScript exceptions, but it also delivers insights to help identify and address issues more quickly, resulting in a better user experience.
To conclude
We hope this article helps you, both to get better information from your users and to log these insights more accurately.
But there’s loads more we can discuss when it comes to dev tools. While the console panel is powerful, it is still a tiny part of the Developer Tools and JavaScript debugging ecosystem using the browser.
If you want to improve the overall quality of your Javascript application by developing a robust error handling methodology, we’ve got a post on that, too:
Tapas Adhikary is a Full Stack Developer. He loves building web apps, mobile apps, and JAMstack solutions. He is a technology blogger who publishes articles for freeCodeCamp, daily.dev, dev.to, his blog.greenroots.info and also in his YouTube Channel. Follow him on Twitter(@tapasadhikary) to stay connected.