Well, you know the basic answer, right? Debugging is about identifying and fixing errors in our code to ensure it runs as expected. But if we’re talking specifically about JavaScript, it gets more complex because we need to dig into the specific errors, tools and challenges of this language.
We’re going to unpack all this stuff in the article that follows, and we’ll
Look at how console.log() can reveal basic information.
Explore how a specific JavaScript debugger allows us to pause execution, set breakpoints, inspect variables, and step through code to find the exact cause.
Provide detailed analysis of specific built-in browser tools like Chrome DevTools, Firefox Developer Tools, or Safari Web Inspector.
We’ll also talk about how remote logging solutions like Bugfender capture real-time error data from user devices, making it easier to fix problems that testing alone might miss. But honestly, we’re not going to give you the hard sell – you’re not here for that, we know.
If want to learn more about console.log(), we have published an in depth article where you will learn some advanced usages and secrets about JavaScript log console.
We’re going to get into all the essentials of JavaScript debugging, zooming into three key areas:
Debugging JavaScript without developer tools.
Using JavaScript debugging tools provided by our browsers (Chrome DevTools, Firefox Developer Tools etc).
Using code editors (specifically, Visual Studio).
Tips and hacks.
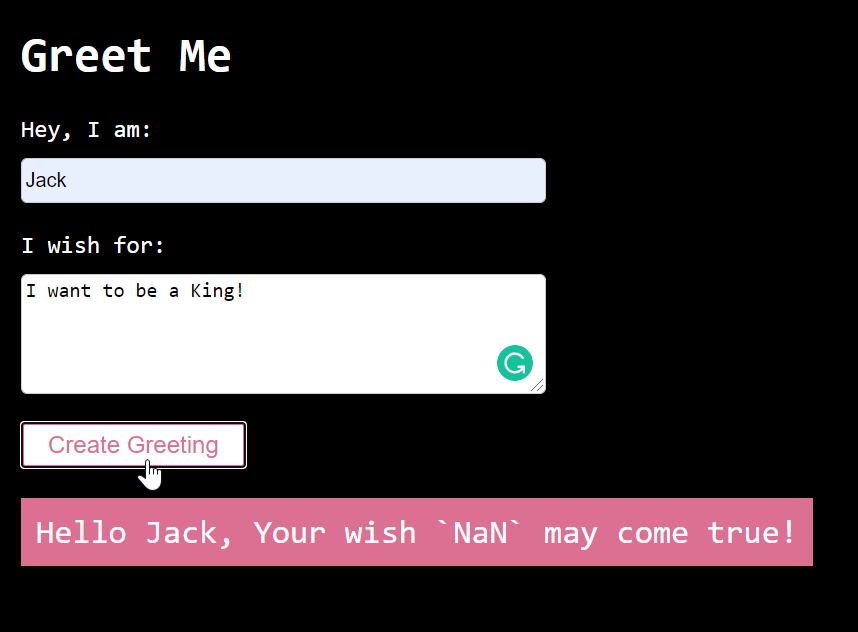
As an example, we’ll be using the Greet Me app. This JavaScript app asks for our name and invites us to submit a ‘wish’, which will deliver a personalized greeting.
Figure 1: The Greet Me app showing an error
You see the problem, right? The greeting message has gone rogue and inserted a random word, NaN. Thankfully, Chrome DevTools will enable us to identify the issue.
Part 1: Debugging JavaScript without developer tools
Anticipating common JavaScript problems
JavaScript errors typically show up in predictable patterns, and anticipating them can save lots of stress later on. Here are some of the most common errors:
undefined and null errors — trying to access properties of missing values.
Off-by-one errors — classic mistakes in loops and array indexing.
Type coercion issues — unexpected results when JavaScript converts types automatically ('5' + 1 = '51').
Scope leaks — accidentally using global variables when we meant to use local ones.
Asynchronous bugs — callbacks, promises, or async/await code not resolving as expected.
DOM manipulation errors — elements not yet loaded or removed from the page.
Silent failures in production — errors users see but we don’t notice unless logged.
Understand the error message
When JavaScript throws an error, the browser typically gives us lots of vital info. We should read the details carefully before touching the code, as it often tells us exactly what’s wrong and where to look.
Identify the error type (ReferenceError, TypeError, etc).
Note the file name and line number.
Click the console link to jump to the source code.
Search the exact message online for explanations.
Check whether the error repeats in the same place.
Reproduce the bug consistently
Before fixing an issue, we need to make it happen consistently so we can study it under controlled conditions. Replicating the bug empowers us to identify the right problem and verify the fix later.
The traditional approach relies on four stages:
Try to recreate the exact sequence of actions leading to the bug.
Test with the same inputs, browser, and environment.
Record any error messages or console logs.
Repeat until you can trigger it consistently.
But of course, a debugging tool can make the process waaaaaaay simpler.
💡Humble flex: With Bugfender, you can search the dashboard for the affected device or user; review recorded console logs, errors, UI events, and network calls; see the exact sequence that led to the bug without guessing; replicate locally only to confirm and test your fix.
Benchmark loops with console.time() and console.timeEnd()
Measuring how long a loop takes to run is useful for performance tuning and comparing different implementations. Specifically, it’s helpful for spotting slow loops, optimizing algorithms, or testing changes.
We can do this using console.time() and console.timeEnd().
Start the timer with console.time('label').
Run the loop or code block.
End the timer with console.timeEnd('label') to display the elapsed time in milliseconds.
Use the same label for both methods so the results match.
Example:
console.time('loop');
for (let i = 0; i < 1000000; i++) {}
console.timeEnd('loop');
Use console.trace() to debug JavaScript function calls
console.trace() helps us see the sequence of function calls that led to a specific point in our code. This is useful for understanding complex flows or finding where a function was triggered.
Here are the steps:
Call console.trace() inside the function you want to inspect.
The browser will print a stack trace showing the chain of calls (this works well for debugging unexpected or multiple function triggers).
Combine with breakpoints or logs for deeper analysis.
Avoid leaving it in production code to prevent unnecessary console noise.
Example:
function test() {
  console.trace();
}
test();
Part 2: Using JavaScript debugging tools
What are JavaScript debuggers?
A JavaScript debugger helps developers inspect, pause, and control the execution of their code to find and fix bugs better. Unlike simple logging, a debugger lets us set breakpoints at specific lines, monitor variable values in real time, and step through code line by line.
Most modern browsers include built-in debuggers—such as Chrome DevTools, Firefox Developer Tools, and Safari Web Inspector—that work in similar ways. These tools make it easier to pinpoint the exact cause of issues, whether they’re syntax errors, logic mistakes, or unexpected browser behavior.
Combined with remote logging platforms like Bugfender, debuggers help capture and resolve even the most elusive JavaScript problems.
Using JavaScript debugging tools in popular browsers
In most modern browsers, we can open the built-in JavaScript debugging tools by:
Pressing F12.
Pressing Ctrl+Shift+I (Windows/Linux) or Cmd+Option+I (Mac).
Right-clicking anywhere on the page and selecting Inspect.
Chrome DevTools
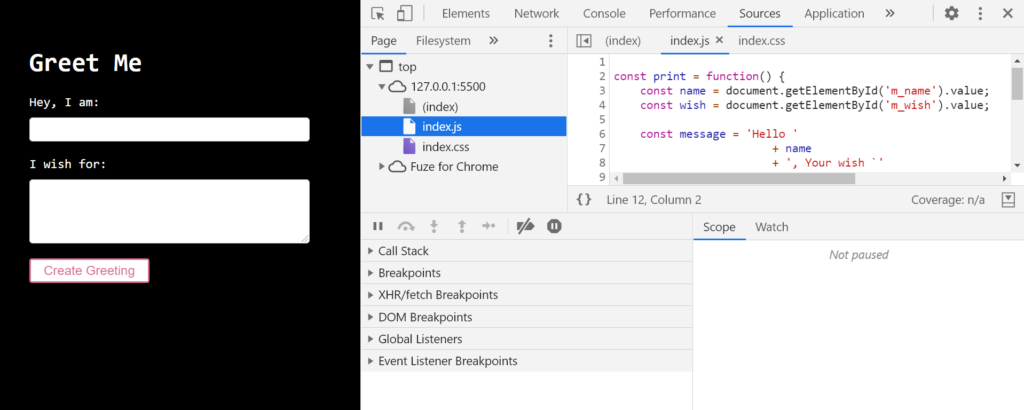
In Google Chrome, the main workspace for JavaScript debugging is the Sources panel. This is where we’ll load and view your scripts, prepare them for inspection, and control how the code runs during the debugging process.
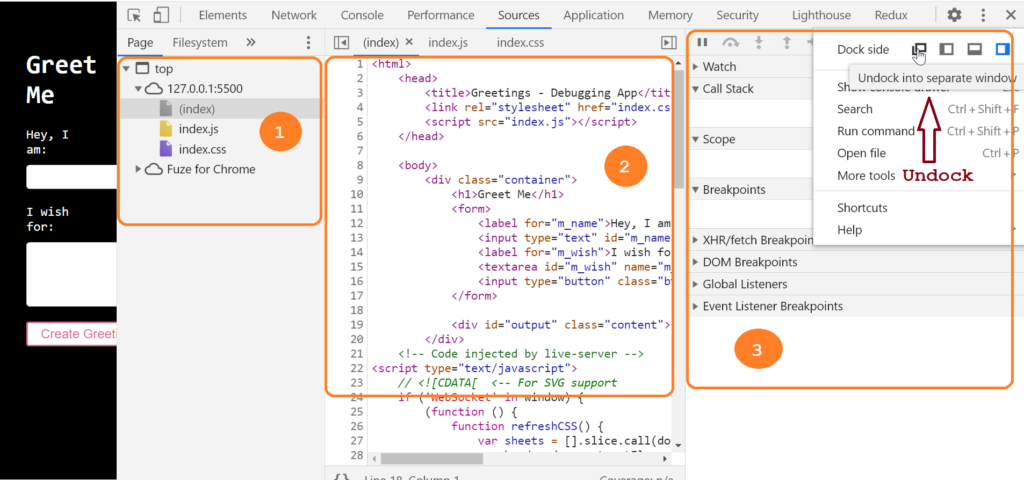
We can also reach it from the browser menu by selecting More tools → Developer tools, then clicking the Sources tab.
Figure 1: Opening the Sources Panel
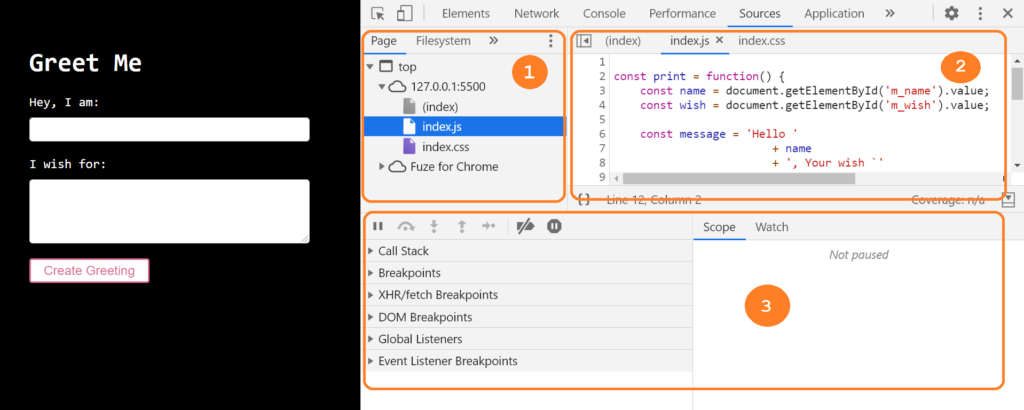
The Sources panel has three primary sections.
Figure 2: Sources Panel sections
File Navigator Section: All the files that our Greet Me page requests are listed here.
Code Editor Section: When you select a file from the navigator pane, the content of the file will be listed here. We can also edit the code from here.
Debugger Section: You will find lots of tools available here to set breakpoints, inspect variable values, watch for changes etc.
If your DevTools window is wide or undocked in a separate window, the debugger section will be displayed to the right of the Code Editor pane.
Figure 3: DevTool window is wide open
Firefox Developer Tools
In Mozilla Firefox, JavaScript debugging happens in the Debugger panel, found within its Developer Tools section.
This panel lets us view loaded scripts and set up our workspace before starting the debugging process. We can also reach it from the browser menu by selecting Web Developer → Debugger.
Microsoft Edge DevTools
In Microsoft Edge, the main workspace for JavaScript debugging is also the Sources panel, similar to Google Chrome. Here, we can view scripts, prepare them for inspection, and manage the debugging process.
We can also reach it from the browser menu by selecting More tools → Developer tools, then opening the Sources tab.
Opera DevTools
In Opera, JavaScript debugging takes place in the Sources panel within its Developer Tools, which works much like Chrome’s. It allows us to load scripts and prepare them for inspection before starting the debugging process.
We can also reach it from the browser menu by selecting Developer → Developer tools, then opening the Sources tab.
Safari Web Inspector
In Safari, JavaScript debugging is done through the Sources panel in the Web Inspector. Before we can access it, we’ll need to enable the Develop menu by going to Preferences → Advanced and checking Show Develop menu in menu bar.
Once enabled, open the menu and select Show Web Inspector, then navigate to the Sources tab to prepare the scripts for debugging.
Now, let’s debug JavaScript with developer tools
Set breakpoints in JavaScript
To begin debugging, the first thing to do is to set breakpoints. Breakpoints are the logical point you want the code execution to pause, so that you can debug it.
Breakpoints are the logical point you want the code execution to pause, so that you can debug it.
DevTools allows you to set breakpoints in many different ways. As we start debugging our application, we will learn how to set them…
At the line of code.
At conditional statements.
At the DOM node.
On Event listeners.
Set breakpoints at the line of code
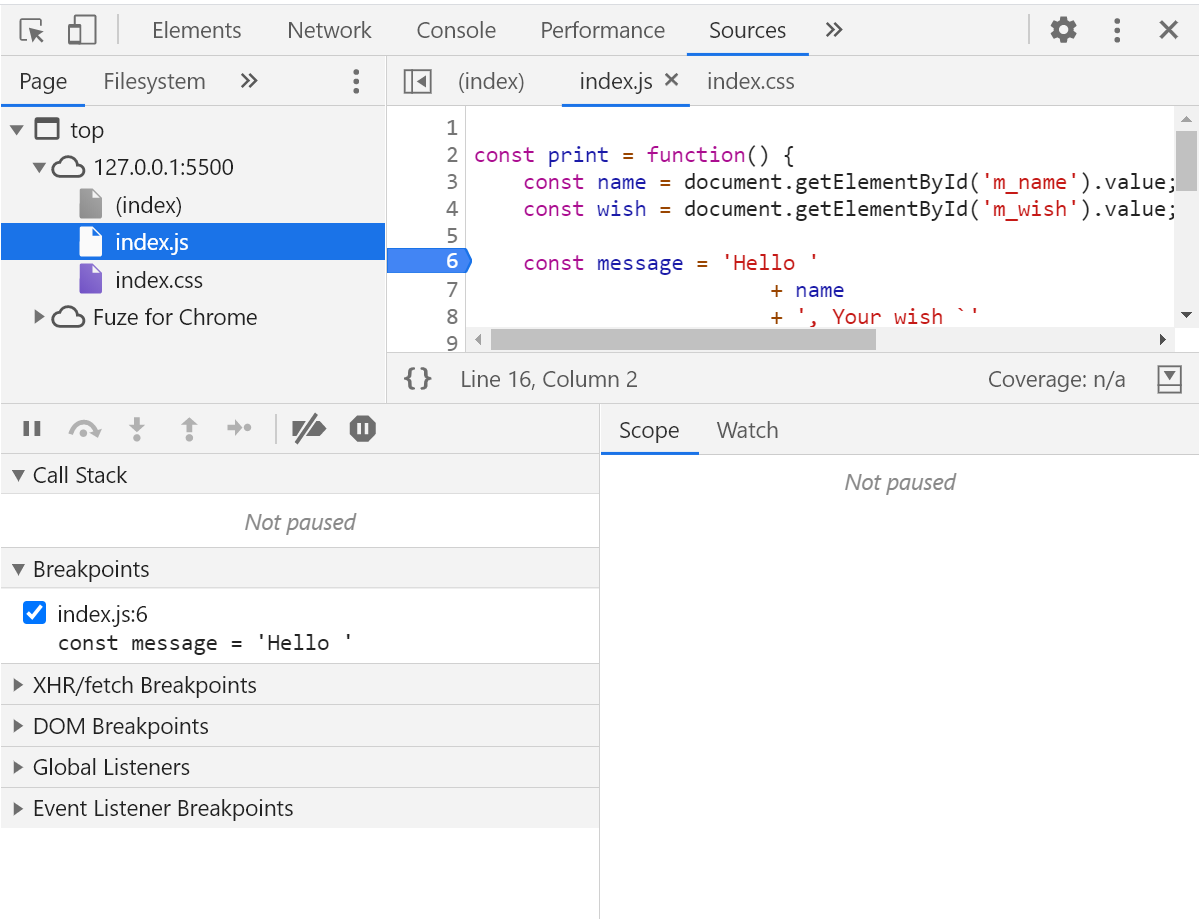
To set a line-of-code breakpoint:
Click the Sources tab.
Browse the source file from the File navigation section.
Go to the line of the code in the Code Editor section on the right.
Click on the line number column to set a breakpoint on a line.
Figure 5: Set a line-of-code Breakpoint
Here we have set a breakpoint at the line number 6. The code execution will be paused here.
Tips: Use this when you do not know the exact region of the code to investigate. Even if you just start from somewhere, based on a guess, it will lead to the bug eventually. You can also set up multiple line-of-code breakpoints and investigate. We will see that in the latter part of the article.
Set a conditional breakpoint
A conditional breakpoint in JavaScript debugging is a powerful tool that allows developers to pause the execution of their code at a specific point, but only when a specific condition is met. This means that instead of hitting a breakpoint every single time the code reaches that line, you can set a condition that must evaluate to true for the breakpoint to trigger.
So, why is this feature so useful? Well, think about a scenario where you are debugging a complex JavaScript application with a large codebase. You may have a particular function that is called multiple times throughout the execution. However, you are only interested in debugging it when a certain condition is met.
With conditional breakpoints, you can set a condition that represents the state or behavior you want to investigate. This could be anything from the value of a variable, the result of an expression, or even the occurrence of a specific event. By doing this, you can focus on the specific instances where the condition is true, saving you time and effort by avoiding unnecessary breaks in the code.
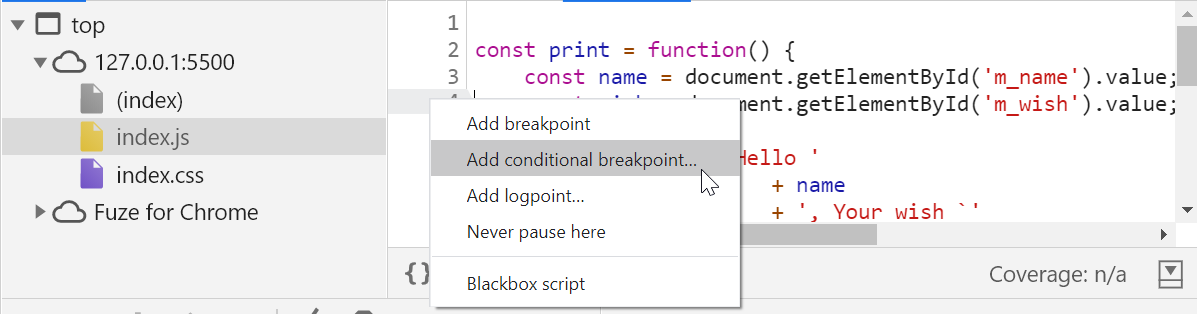
To set a conditional breakpoint:
Click the Source tab.
Browse the source file from the file navigation section.
Go to the line of the code in the code editor section on the right.
Right-click on the line number and select the Add conditional breakpoint option.
Figure 6a: Right-click on the line number
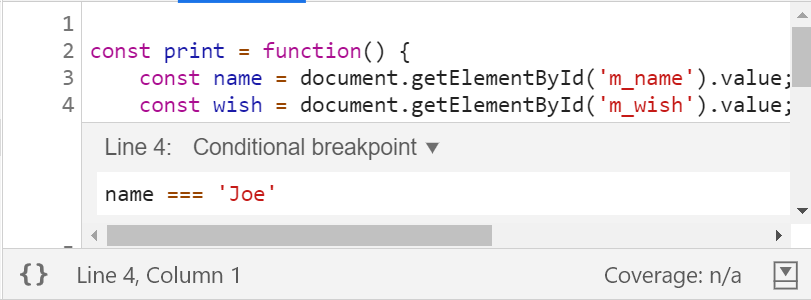
A dialog box appears below the line of code. Start typing the condition. As you type, you will see the autocomplete option suggesting you pick up a condition.
Figure 6b: Enter a condition
Press Enter to activate the breakpoint. You should see an orange icon appear on top of the line number column.
Figure 6a: A conditional breakpoint has been activated
The code execution will be paused whenever the function print() is invoked with the name Joe.
Tips: Use the conditional breakpoint when you know the specific region of code to investigate. As you may be aware of the region of the code, you can inspect further using conditions to find the root cause of the problem.
Set breakpoint on event listeners
Setting breakpoints on event listeners is a very useful technique when it comes to JavaScript debugging. By strategically placing breakpoints at the appropriate event listeners in your code, you gain the power to pause code execution and examine the state of your program at a specific moment. This allows you to pinpoint and resolve any issues or unexpected behavior that may arise within your event handling logic.
When you set a breakpoint on an event listener, you are essentially telling the debugger to take a pause when that specific event occurs. It allows you to inspect variables, step through code, and identify exactly what happens when that event is triggered. This detailed analysis helps you understand the flow of execution and uncover any potential bugs or logical errors.
To set a breakpoint on event listeners:
Click the Sources tab.
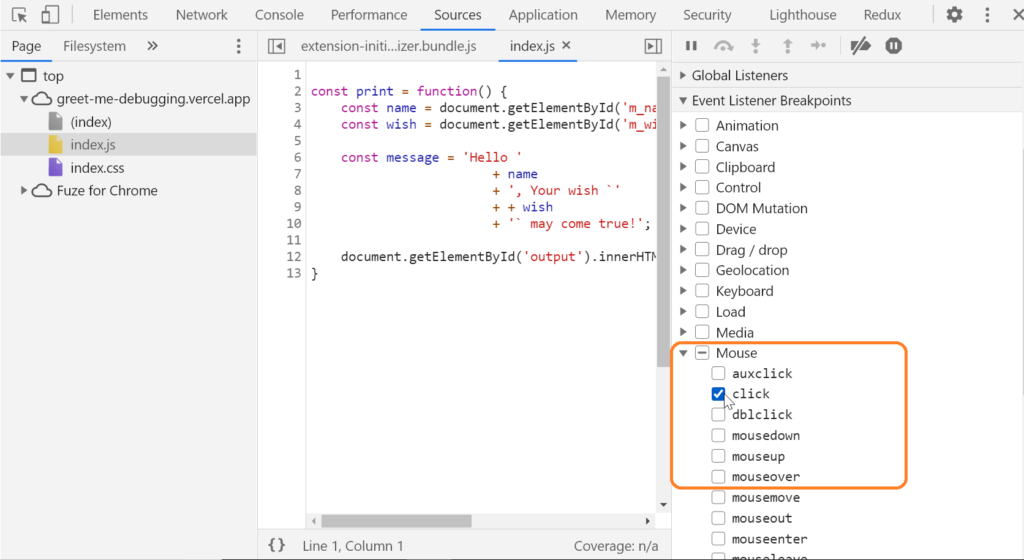
Expand the Event Listener Breakpoints pane in the debugger section.
Select the list of event listeners from the category list to set breakpoints. We have a button click event in our application. We will be looking to select the click checkbox under the mouse option.
Figure 7: Set a breakpoint on the click event listener
Tips: Use this when you want to pause the event listener code that runs after an event is fired.
Set breakpoint at the DOM node
DevTools is equally powerful when it comes to DOM inspection and debugging. You can set breakpoints to pause a code execution when something is added, removed or, changed in the DOM.
To set breakpoints on DOM change:
Click the Elements tab.
Go to the element that you want to set the breakpoint on.
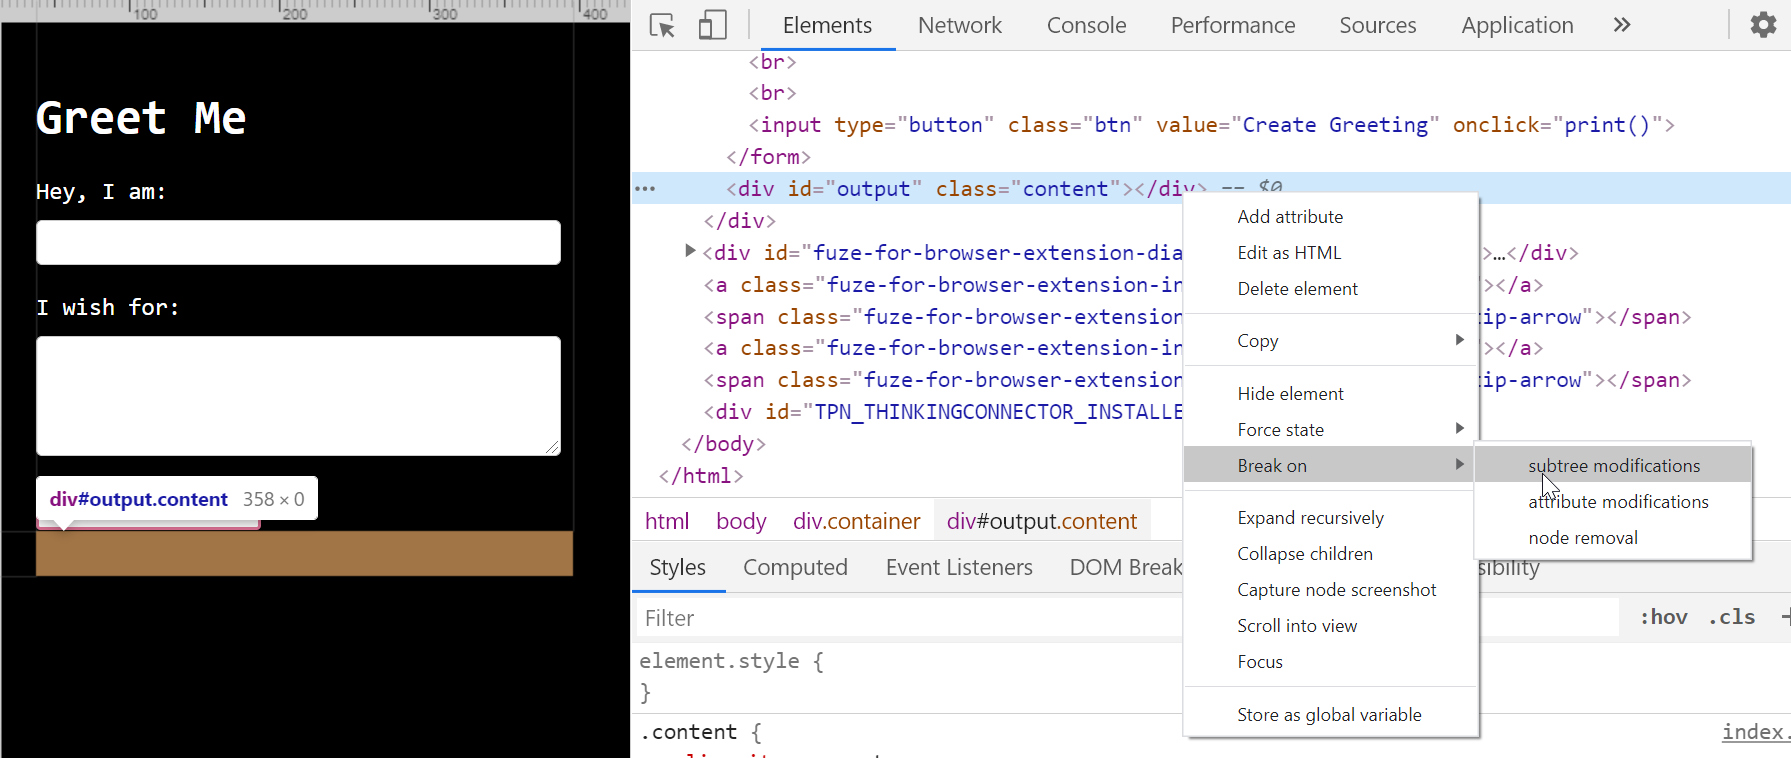
Right-click on the element to get a context menu. Select Break on and then select one of: Subtree modifications, Attribute modifications, or Node removal.
Figure 8: Adding a breakpoint on the DOM change
As you see in the above figure, we are setting a breakpoint on the DOM change of the output DIV with a condition of Subtree modifications. We are aware that a greeting message will be added into the output DIV and the subtree will be modified to break on it.
Tips: Use this when you suspect a DOM change is causing the bug. The related JavaScript code execution will be paused automatically when it breaks on the DOM change.
Use the JavaScript debugger statement
The debugger statement is a built-in JavaScript feature that tells the browser to pause code execution at that exact line, just like a manual breakpoint.
To use this feature, we can insert debugger; in our code where we want execution to stop. When the browser runs that line with DevTools open, it will pause automatically, allowing us to inspect variables, check the call stack, and step through code from that point.
This is especially useful when we can’t easily set a breakpoint in the Sources panel, for example, inside dynamically generated code or complex event handlers. One thing though: we must remember to remove or comment out debugger; before deploying to production.
Step through the Source Code
Now we know all the important methods to set breakpoints. In a complex debugging situation you may have to use a combination of them. Let us see how to step through the breakpoints to figure out an issue.
The Chrome debugger section provides five controls to step through the code.
Figure 9: Step through controls
Step(Key shortcut – F9)
This option enables you to step through line by line as the JavaScript code executes. If there is a function call on the way, the step-through also gets inside the function, executes it line by line, and then steps out of it.
Figure 9a: Performing step line-by-line
Step Over (Key shortcut – F10)
This option allows you to execute a function without stepping into it. Occasionally, you may be certain that some functions are working properly and not want to spend time inspecting them. In this situation, you should use the step over.
In the example below, we are stepping over the logger() function.
Figure 9b: Step Over the function
Step Into (Key shortcut – F11)
Use this option to investigate a function in greater depth. When stepping through, you may have the feeling that a function is behaving unexpectedly and want to inspect it. Use step into to get inside the function and debug.
In the example below, we are stepping into the function logger().
Figure 9c: Step into the next function call
Step Out(Key shortcut – Shift + F11)
While stepping through a function, you may not want to continue and come out of it. Use this option to step out of a function.
In the example below, we are stepping inside the logger() function and then stepping out of it immediately.
Figure 9d: Step out of the current function
Resume/Jump (Key shortcut – F8)
At times, you may want to jump from one breakpoint to another without debugging any code in between. Use this option to jump to the next breakpoint.
Figure 9e: Resume or Jump to the next breakpoint
Use the JavaScript debug console to inspect and test code
The JavaScript Debug Console lets us interact directly with our page’s code while it’s running. Combined with console.log() and related methods (console.warn(), console.error()), it’s one of the fastest ways to inspect and test code.
Here’s how to use it effectively:
Open the console in the browser’s DevTools.
Add console.log() in the code to output variable values or checkpoints.
Check logs for errors, warnings, or messages you’ve added.
Type variable names to see their current values instantly.
Run JavaScript commands to test changes without reloading.
Call functions manually to verify behavior.
💡 With Bugfender, all console outputs can be captured remotely, so you can review them even for production issue
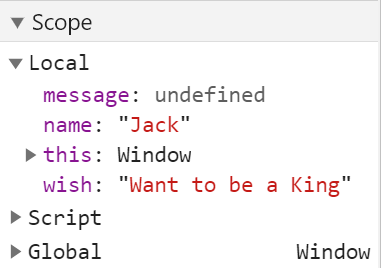
Inspect global scope and this in JavaScript
Using the scope panel, we can find out what the global scope contains and what its variables are. We can also find out the value of the this keyword.
Figure 10a: Scope panel
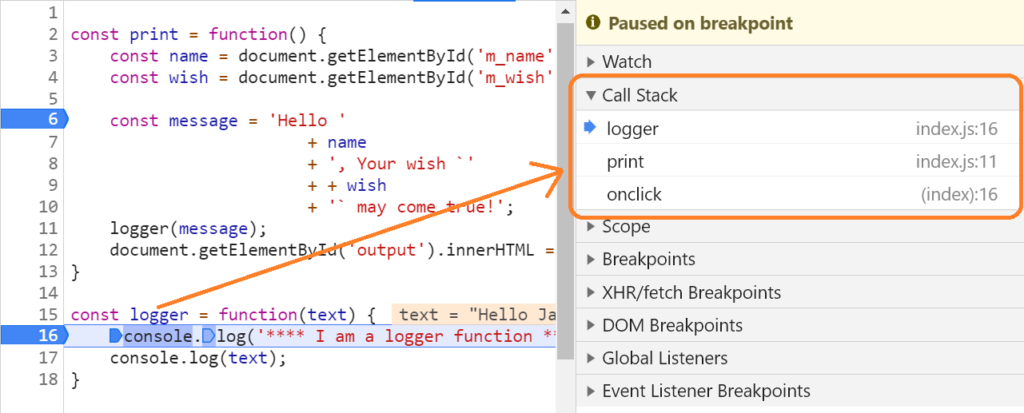
Debug function execution with the call stack
The call stack panel helps to identify the function execution stack. By examining the call stack, developers can understand the order in which functions are being called and the function hierarchy. This information is crucial for understanding the flow of execution and can be a really helpful tool in debugging complex JavaScript code.
Figure 10b: Call stack
Inspect variable and expression values in DevTools
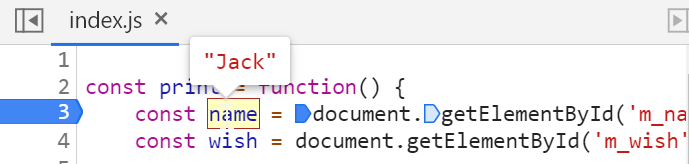
Inspecting values is the primary way to identify a bug in the code. When stepping through, you can inspect a value simply by doing a mouseover on a variable.
In the example below, we are selecting the variable name to inspect its value at the code execution stage.
Figure 10c: Inspect a value with mouseover
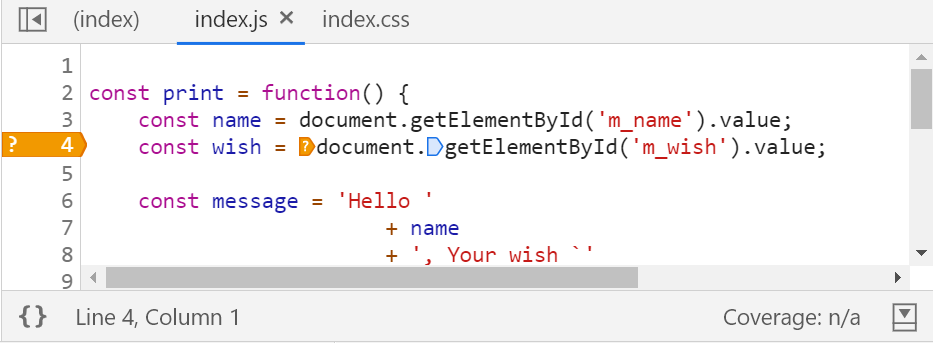
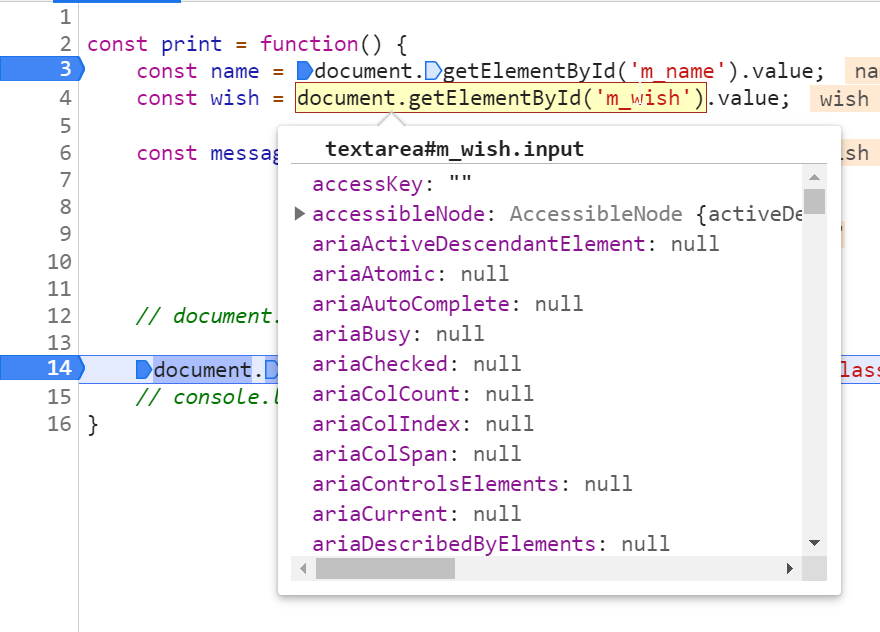
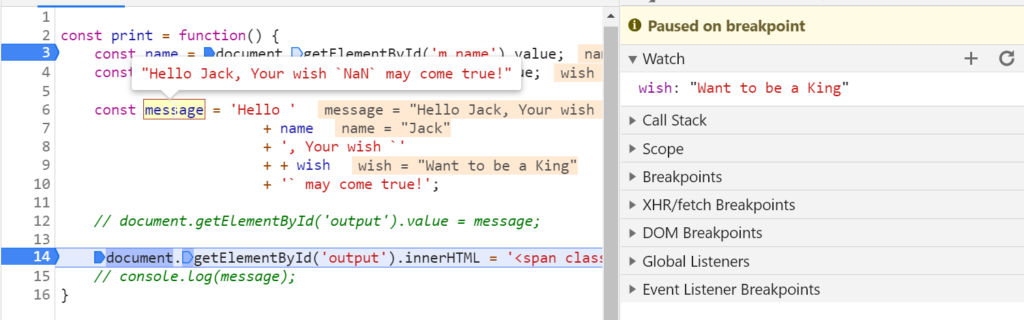
Additionally, you can select a section of the code as an expression to check the value of it. In the example below, we have selected an expression document.getElementById('m_wish') to inspect the value.
Figure 10d: Inspecting value of an expression
The Watch section enables you to add one or more expressions and watch their values at execution time. This feature is very useful when you want to do some computation outside your code logic.
Monitor JavaScript expressions with the watch panel
You can combine any variables from the code region and form a valid JavaScript expression. At the time of stepping through, you will be able to see the value of the expression.
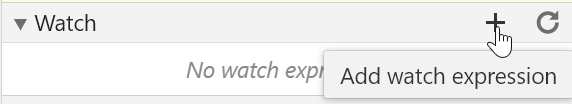
Here are the steps required to add a Watch:
Click on the + icon above the Watch section
Figure 11a: Add a watch expression
Add an expression to watch. In this example, we have added a variable wish to watch its value.
Figure 11b: Watch expression value
Another way to watch for an expression is from the console drawer. See the example below to know how to activate it.
Figure 11c: Activate the console drawer
Disable & Remove Breakpoints
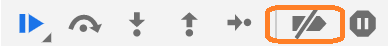
To disable all the breakpoints at once, click on the Deactivate Breakpoints button(it is circled below.)
Figure 12a: Disable all breakpoints
Please note, the above method doesn’t remove the breakpoints. It just deactivates them for the duration you require. To activate the breakpoints, please click on the same button again.
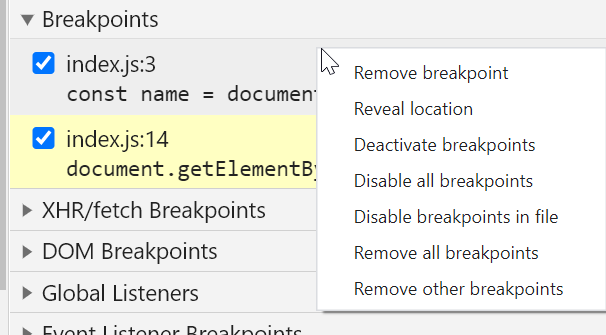
You can remove one or more breakpoints from the Breakpoints panel by unchecking the checkboxes. You can remove all the breakpoints permanently by doing a right-click and selecting the option, Remove all breakpoints.
Figure 12b: Remove one, more or al the breakpoints
Finally, apply the fix
With all that we have learned so far, what do you think is the fix to make the Greet Me app functional as expected? Have you figured that out already?
In case not, it’s just that extra + before the wish variable while constructing the message.
// This is the line where the issue is.
// Identify the extra '+' before the wish.
const message = 'Hello '
                        + name
                        + ', Your wish `'
                        + + wish
                        + '` may come true!';
How would we find that in a realistic debugging scenario? Have a look at this short video demo(without audio),
Part 3: How to debug JavaScript with Visual Studio code
As well as specialist debugging tools, we can also use the built-in features provided by code editors. And Visual Studio is one of the best around (we think, anyway).
Visual Studio code is ridiculously simple, and we can enable a similar kind of debugging environment using VS Code with just a few simple steps.
VS Code setup for debugging
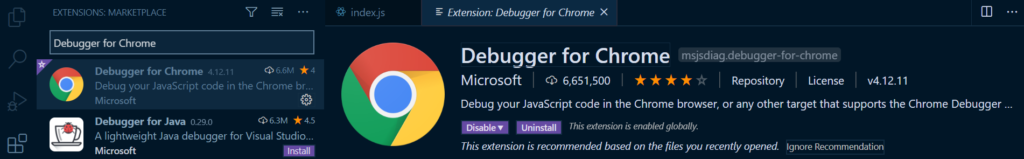
VS Code has several extensions (like plug-ins) for enabling various features and capabilities. To enable JavaScript debugging, you need to install an extension called Debugger for Chrome. You can install it in either of these ways:
Go to the Debugger for Chrome homepage and click on the Install button. This will launch the VS Code and start the installation for you automatically.
You can search this extension in the Extensions panel of VS Code and install.
Figure 13a: VS Code extension install
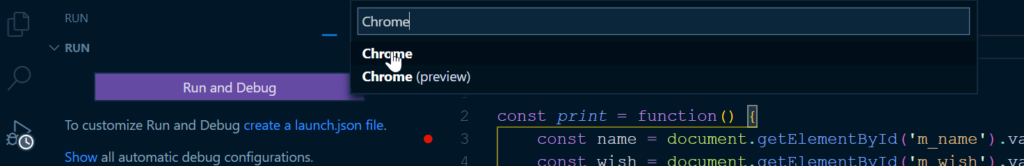
After installation, click on the Run option from the left and create a configuration to run/debug a JavaScript application.
Figure 13b: Enable debugging with configuration
A file called launch.json will be created with some setting information in it. It may look like this:
{
    // Use IntelliSense to learn about possible attributes.
    // Hover to view descriptions of existing attributes.
    // For more information, visit: <https://go.microsoft.com/fwlink/?linkid=830387>
    "version": "0.2.0",
    "configurations": [
        {
            "type": "chrome",
            "request": "launch",
            "name": "Debug the Greet Me app",
            "url": "<http://localhost:5500>",
            "webRoot": "${workspaceFolder}"
        }
    ]
}
You may want to change the following parameters:
name: Anything suitable to your app. It is optional to change.
url: The URL that your app is running on locally.
webRoot: By default the value is ${workspaceFolder}, which is the current folder. You may want to change it to the entry point folder where a file like index.html is located.
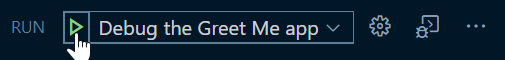
The last step is to start the debugging by clicking the small play icon at the top-left corner.
Figure 13c: Start debugging
Understanding VS Code debugger panels
VS Code provides similar tools to DevTools for debugging JavaScript, and it is broadly similar to the Google Chrome JavaScript debugger we have seen so far in this article.
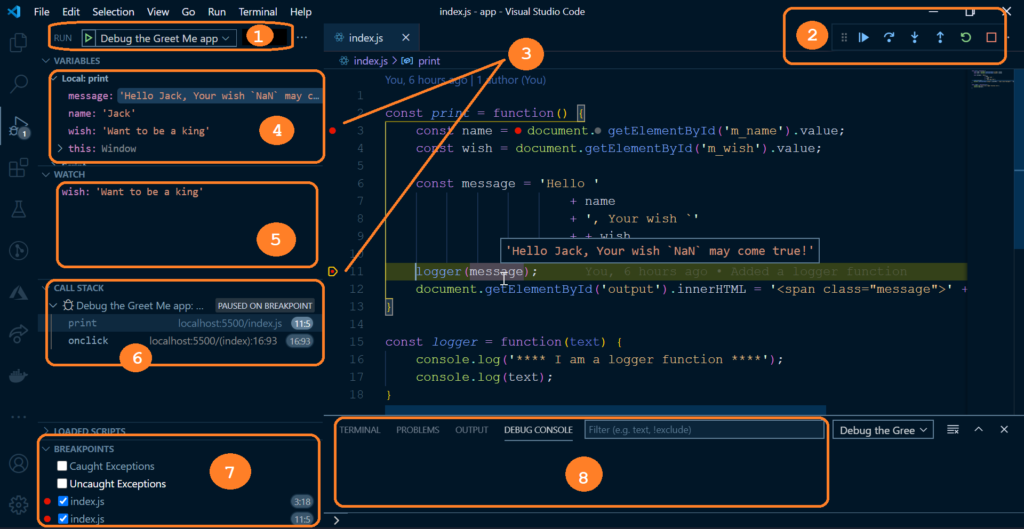
Here are the primary sections you should be aware of:
Enable debugging. Press the play button to enable the debugging option.
Controls for stepping through the breakpoints and to pause or stop debugging. This is almost similar to the one we have seen with Chrome DevTools except some of the keyboard shortcuts may differ.
Setting breakpoints on the source code. This is similar.
The scope panel to see variable scopes and values. These are completely the same in both cases.
The watch panel to create and watch expressions.
The call stack of the execution function.
The list of breakpoints to enable, disable and remove.
The debug console to read the console log messages.
Figure 13d: Anatomy of the VS Code debugging controls
A quick demo
Here is a quick demo(1 minute) to showcase the VS Code debugging control usages.
Part 4: Tips and hacks to debug JavaScript faster
Quick gains when debugging
By focusing on the right parts of our code and using modern DevTools features,, we can quickly identify the issues and fix them in minutes, not hours.
Focus on key code areas first — start with recent changes, complex functions, or failing tests.
Use console.table() — render arrays and objects as readable tables to quickly identify bad values.
Unminify minified code — use Pretty Print in DevTools to expand bundled code into readable lines.
Black box irrelevant scripts — hide vendor or library code so you only step through your logic.
How to avoid common JavaScript bugs
Most bugs aren’t mysterious — they come from a handful of avoidable mistakes. With the right practices, you can prevent many issues before they appear.
Use strict mode — catch undeclared variables and silent errors early.
Validate user input — never trust raw input; sanitize and check types.
Test in multiple browsers — quirks in Chrome, Safari, and Firefox often differ.
Automate testing — unit tests and linters spot regressions before release.
Log and monitor with Bugfender — catch errors happening in real user devices, not just your test environment, so you can fix issues before they spread (sorry, we had to throw this one in there before we signed off!)
JavaScript Debugging FAQ
What is JavaScript debugging?
JavaScript debugging is the process of finding and fixing errors or issues in JavaScript code to ensure that it runs smoothly and produces the expected results.
Why is JavaScript debugging important?
JavaScript code can contain bugs or errors that can cause unexpected behavior or even make the code unusable. Debugging helps developers identify and resolve these issues, ensuring that the code functions as intended.
What are some common types of JavaScript errors?
Some common types of JavaScript errors include syntax errors, logic errors, and runtime errors. Syntax errors occur when the code violates the syntactical rules of JavaScript. Logic errors lead to incorrect program behavior, while runtime errors occur during program execution.
How can I debug JavaScript code in a web browser?
Most modern web browsers come with built-in developer tools that include js debugging capabilities. These tools allow you to set breakpoints, inspect variables, analyze network traffic, and more. Examples of popular browser developer tools are Chrome DevTools, Firefox Developer Tools, and Microsoft Edge DevTools.
What is a breakpoint in JavaScript debugging?
A breakpoint is a point in the code where the debugger will pause execution, allowing you to inspect the state of the program at that particular point.
How do I set a breakpoint in JavaScript?
In most browser developer tools, you can set a breakpoint by clicking on the line number of the code where you want the execution to pause. When you run the code in js debug mode, the program will halt at the specified breakpoint.
How can I debug JavaScript code in Microsoft Edge?
To debug JavaScript in Microsoft Edge, open the Developer Tools by pressing F12 or Ctrl + Shift + I. Use the “Sources” tab to access your JavaScript files. Set breakpoints by clicking on line numbers, step through the code using the debugger controls, and inspect variables and call stacks. Microsoft Edge’s Developer Tools, similar to those in Chrome, provide a robust environment for debugging JavaScript, allowing you to efficiently identify and resolve issues in your code.
How can I debug JavaScript code in Chrome?
To debug JavaScript in Chrome, open Developer Tools (DevTools) by pressing F12 or Ctrl + Shift + I (Cmd + Opt + I on Mac). Use the “Sources” panel to view your JavaScript files, set breakpoints by clicking on the line numbers, and step through your code using the debugger controls. You can inspect variables, watch expressions, and examine the call stack to diagnose and fix issues in your JavaScript code. Chrome DevTools provides a comprehensive environment for effective JavaScript debugging.
How can I debug JavaScript code in Firefox?
To debug JavaScript in Firefox, open Firefox Developer Tools using Ctrl + Shift + I (or Cmd + Opt + I on Mac), select the “Debugger” tab, set breakpoints in the JavaScript files, use the step controls to navigate through the code, and inspect variables and expressions. Firefox’s Debugger provides tools similar to Chrome’s DevTools for efficient JavaScript debugging.
How can I debug JavaScript code for mobile devices?
To debug JavaScript code for mobile devices, you can connect your device to your computer and use browser developer tools, such as Chrome DevTools or Safari Web Inspector, to inspect and debug the code running on the device’s browser.
How to Debug JavaScript in Visual Studio Code?
Visual Studio Code supports JavaScript debugging via an built-in debugger that gets installed by default. Previously it was done through extensions like ‘Debugger for Chrome’ but this has been deprecated.
Summary
To Summarize,
It is always better to use a tool to debug JavaScript code. A tool like the Google Chrome DevTools or VS Code debugger extension is much better than just relying on the console.log().
DevTools Source Panel is extremely powerful, with the capability to inspect variable values, watch expressions, understand scopes, read the call stack etc.
There are several ways to set breakpoints and we should use them based on the debugging situation.
Managing breakpoints is simple with DevTools.
The VS Code debugger extension is equally powerful and a must-try.
💡And one last thing: Even when using a debug tool for local development, remember that it’s good to add meaningful console.log() commands, because with Bugfender you will be able to gather information about problems that are happening when the app is already in production.
That’s all for now. Thank you very much for reading through, hope you find this article useful. Happy debugging!
Tapas Adhikary is a Full Stack Developer. He loves building web apps, mobile apps, and JAMstack solutions. He is a technology blogger who publishes articles for freeCodeCamp, daily.dev, dev.to, his blog.greenroots.info and also in his YouTube Channel. Follow him on Twitter(@tapasadhikary) to stay connected.