5 Minutes
The Tech Stack Behind Bugfender
Fix Bugs Faster! Log Collection Made Easy
Whenever I meet an engineer and chat with him about Bugfender, one of the questions I get asked most often is: what does it take to build a log aggregation tool like Bugfender? What’s behind it?
When processing millions of log lines per day for several thousand users, coming from millions of devices, good architecture is key to enabling uninterrupted high-speed processing and growing the platform as new users sign up.
Log aggregators are especially critical when something goes wrong in an application, because the number of logs or crashes to be processed can grow exponentially in double-quick time, maybe without prior warning. And it’s at that moment that our customers want to check their logs the most, so we need to be able to handle that.
This encouraged me to write this blog post, explaining a little bit of the architecture and tools we’re using behind the scenes. We want to show what’s inside Bugfender, both to highlight the complexities behind what could be construed as a relatively simple UI (thanks to the great work of our designers and engineers) and at the same time explain the tools that we’ve built on, which perform an equally heroic role but are often completely invisible to end users.
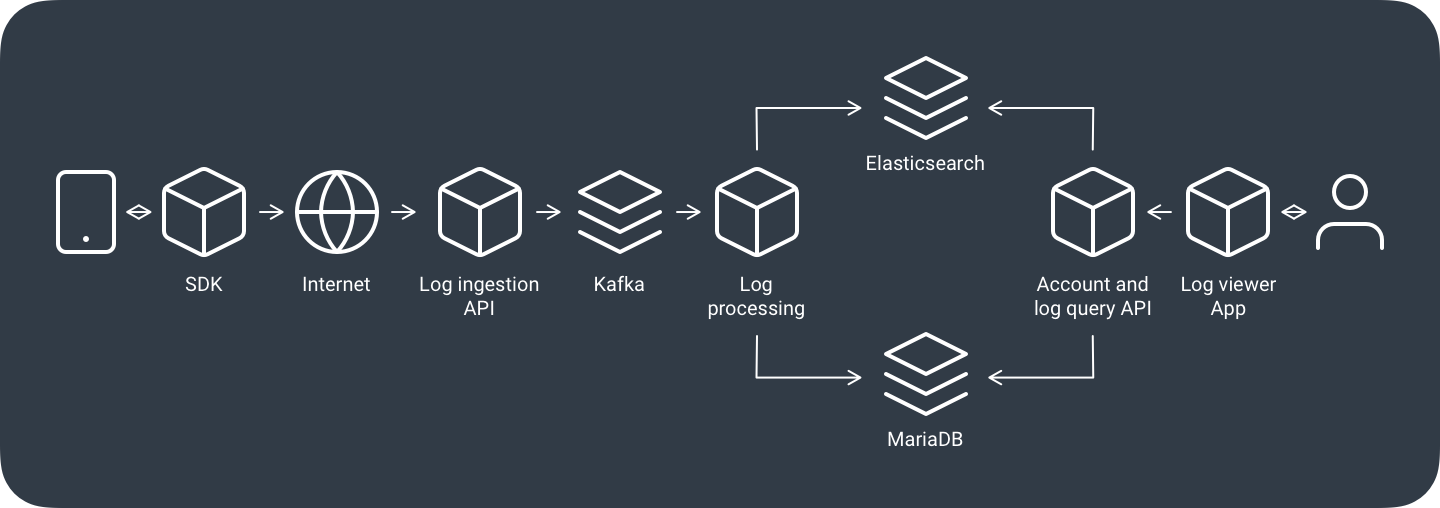
Our log processing pipeline is supported by a set of services written in Go, each of which takes an area of responsibility and scales independently. Here’s a general overview of the journey logs go on:
- Logs originate in our customers’ applications, most often mobile applications. We have a set of SDKs that allow them to send logs from several platforms without having to worry too much about what’s happening inside. Our SDKs perform many complex tasks in the background, like batch-sending logs to save network bandwidth and battery power, or temporarily buffering logs so that network operations can be retried later if the device happens to be offline.
- On the server side, the log ingestion API receives logs and stores them to disk immediately. The API performs a few integrity checks, but its main purpose is to commit to disk and respond as soon as possible. This lets us decouple the arrival of logs from the actual storage process, which can be quicker or slower depending on the current load of the platform. The ingestion API stores logs in a set of Apache Kafka brokers, as Kafka lets us redistribute the work between log processors.
- Log processors are performing many tasks, but the main one is transforming and storing the logs in their final destination. Logs are stored in an Elasticsearch cluster. Elasticsearch is a NoSQL database specialized in textual searches (hence the “search” in its name, although a lot of people get confused and believe it’s purely a search engine). Log processors also perform other tasks like integrity checks, and calculations of key statistics and user quotas. This metadata is maintained mostly in MariaDB databases and the whole thing is accelerated with Redis caching.
- The account management and log-querying API enables our users to access their stored logs and metadata from the storage servers and manage their accounts. Our log viewer web application uses that API internally.
- We have several other supporting microservices for things like sending emails, archiving old logs, observing the overall performance of the platform and generating alerts, generating test data or stress-testing new installations.
High-availability and high-scalability log collection
It’s very important for us to keep operating 24/7, regardless if a disk has broken, the network is unreliable, power has gone down in one of our locations… or any other of the things that are never supposed to happen but do happen eventually.
When running a service for long enough, even the most improbable things will end up happening, so one needs to be prepared. Also, sometimes we need to run maintenance tasks like updating or replacing a server. Having a high-availability setup lets us start and stop instances or even whole machines without having to worry about affecting our users.
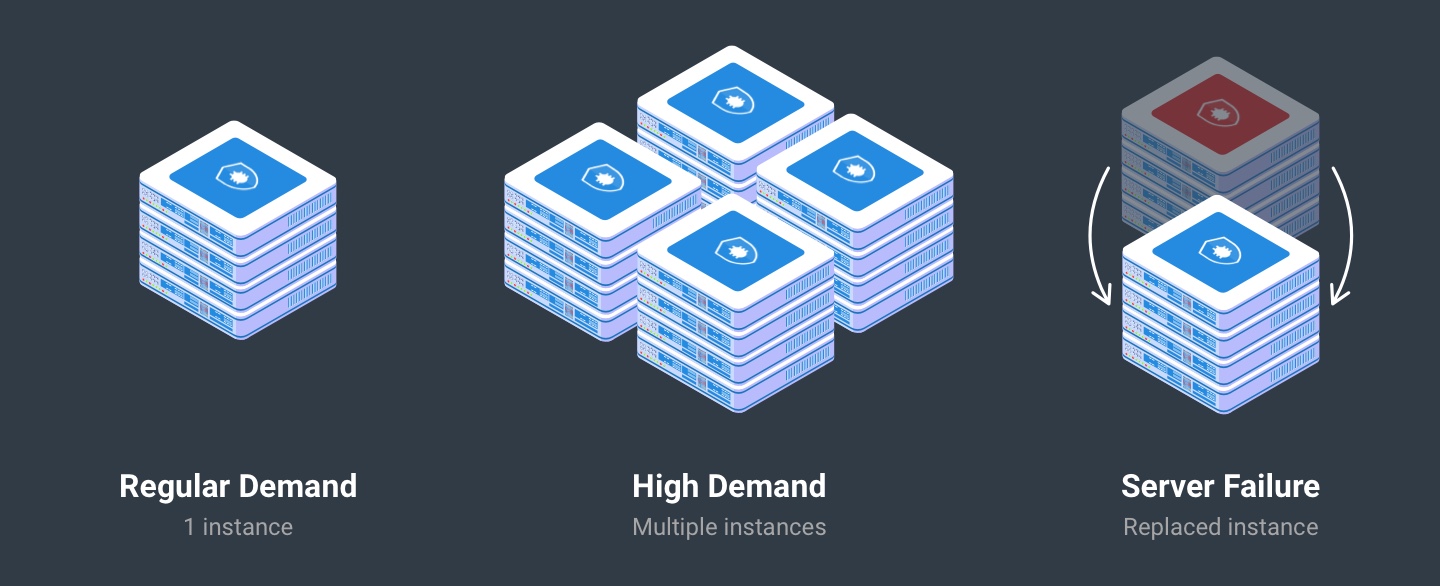
All our microservices are stateless. This design constraint means we can run multiple instances and scaling up is just a matter of adding more machines with more instances of the services. Also the storage technologies chosen can either be clustered for high availability and horizontal scalability (like Elasticsearch, Kafka or Redis) or can at least be replicated for high availability when horizontal scalability is not required (like our MariaDB instance – although we might replace it with a Galera cluster soon to support horizontal scalability).
All of this is run in a Rancher platform that supervises and, if need be, respawns and reallocates instances between our machines, ensuring everything keeps running smoothly all the time.
Are you a freelance software developer or looking for an engineering job?
If you found this post interesting and would like to learn more, or if you are already familiar with some of these technologies and would like to keep working on them, we’d love to hear from you!
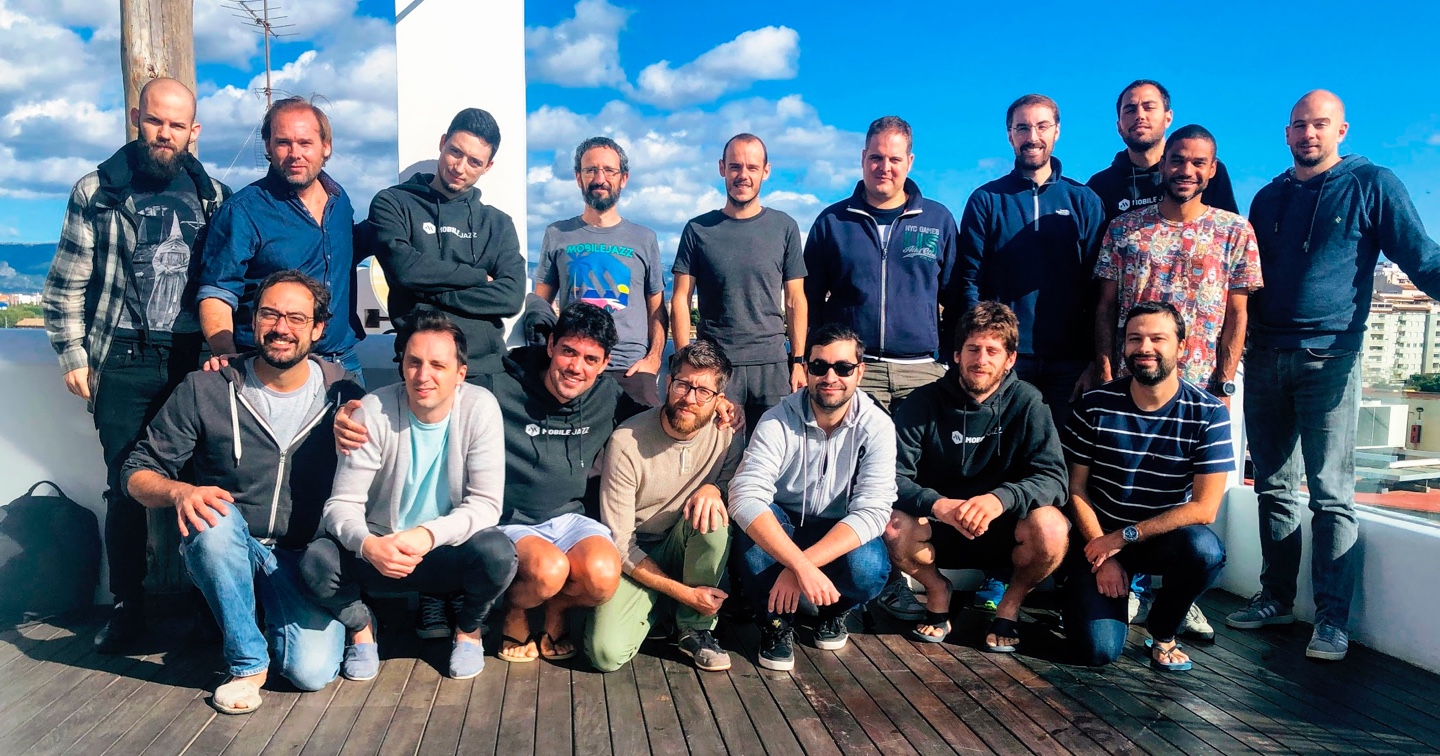
By joining our team you can participate in building Bugfender. Learn more and apply through our Jobs API. Bugfender is run by a fully remote team mostly based in Europe, so you can join us from anywhere.
Expect The Unexpected!
Debug Faster With Bugfender

