9 Minutes
How to Use Android Vitals to Improve App Stability and Google Play Ranking
Fix Bugs Faster! Log Collection Made Easy
If you want to run a health-check on your Android app, Android Vitals is a great piece of kit.
Developed by Google and available on the Google Play console, this performance and stability checking tool helps us fix issues proactively, improve the technical quality of our apps, and avoid uninstalls. Crucially, it will also improve our Google Play ranking, because Google Play ranks app quality using Android Vitals data.
And the really great news? We don’t need to write any code to use Android Vitals; Google automatically collects data from our app and shows the relevant metric in the Play Console. However, if we want to really maximize Android Vitals, we need to do a bit more digging.
So over the next few hundred words, we’re going to open up Android Vitals, looking at stuff like:
- How we set up Android Studio.
- How we can maximize the benefits of Google Play.
- How we deal with edge cases and common technical issues.
- How can we achieve app store optimization by monitoring core vitals proactively.
The article should be ideal for any developer who is new to Android Vitals and wants a working knowledge. It’s a topic that you can get to grips with quickly, so by the end of this article you should be ready to fly.
Table of Contents
- But first, some core concepts to understand
- Ok, now let’s look at setting up Android Vitals
- Part 2: More advanced concepts on Android Vitals
- Finally, let’s look at different metrics and edge cases
- Android Vitals FAQ
- What is Android Vitals and why is it important for app developers?
- How can I access Android Vitals in the Google Play Console?
- Do I need to add code to use Android Vitals in my app?
- What does ANR rate mean in Android Vitals?
- How can I fix battery drain issues highlighted in Android Vitals?
- What causes slow UI rendering in Android apps?
- How does Android Vitals affect my app’s ranking on Google Play?
- And we’re done!
But first, some core concepts to understand
As an Android Vitals rookie, there are some acronyms you’ll need to grasp. Here are three that every Android developer should know.
- The Application Not Responding (ANR) rate shows the percentage of sessions where the app freezes.
- The LMK (low memory kill) rate shows the percentage of foreground service.
- The crash rate shows the percentage of user-perceived crashes of active users on a daily basis.
And there’s some other core stuff that will come up when we get our Android Vitals reports.
Start-up times. When the app initially starts and calls the onCreate() method, it has three metric data points: cold start (when the app is relaunched after running in the background for a while), warm start (when the app is brought to the foreground from the background), and hot start (when the app’s activity is already in the foreground).
Rendering UI. This refers to the rate at which a frame is generated from our app, and displayed upon the screen. If our apps have a UI refresh rate below 60 FPS, this is termed excessive slow frames. If a frame takes more than 700 ms to render, this is called excessive frozen frames.
Battery Usage: This provides a metric for how much battery life is being drained in different sessions. The key sessions are app wakeup, wake locks (when the app carries on running when the screen is off), background WiFi scans and background network usage.
Permission: This shows how many permissions we are denying the user. If we are taking unnecessary permissions, this indicates bad UX design and may impact our app store optimization.
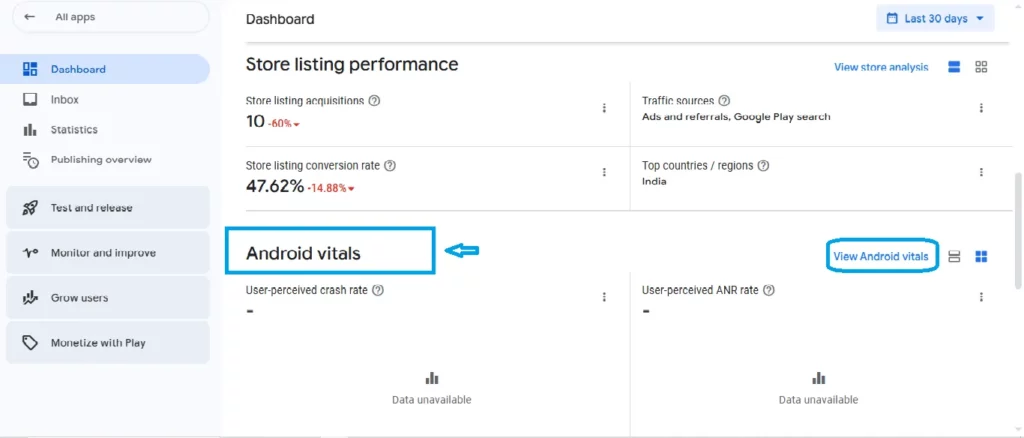
Now, I now what you’re wondering: how can I find all that data?
Well all we need to do is log into the Play Console and select the apps for which we want to receive Android Vitals data. Here’s a screenshot.
Ok, now let’s look at setting up Android Vitals
How do we set up Android Vitals using Android Studio?
As mentioned, we don’t need to write any code in our app to set up Android Vitals. Google Play does the work for us, and all we’ve got to do is follow this path.
- Select the app that we want to monitor in our Play console.
- Navigate to “Monitor and improve > Android Vitals > Overview.”
Simple! Once we upload the file to the Play Store, Google will start collecting data about its performance and quality, and the dashboard means we can monitor it easily.
Now let’s see how Android Vitals works in Google Play
Once Android Vitals has processed the data, it will show in the Play Console in different metrics. Let’s go point by point.
- Data Collect: When the app runs on an Android device, Google will collect the performance data automatically and store the data in its database. The data is stored in different metrics, like devices and regions.
- Data Process: Google Play processes raw data into specific Android Vitals metrics. These metrics are grouped by device, device OS, region, country, and app version. The groupings help us to identify the issues properly.
- Monitor Dashboard: We can easily view the data in the Android Vitals dashboard to identify app performance and stability.
And that’s the basics done! If you still have any doubts, check out the official Android app developer video.
Part 2: More advanced concepts on Android Vitals
Ok, now we’re hitting the big stuff: complex debugging, deep-checking of performance issues and analysis of Play Console reports. These advanced concepts will help us improve app stability and, just as importantly, reduce crashes and ANR.
Once we’ve optimized the crashes, Google will automatically improve our ranking in the Play Store, and our app will become virally popular around the world (ok, we can’t control the last bit, but you get my point).
So let’s look at some ways we can improve our ranking.
- Debug ANR (Application Not Responding): When the main UI thread is blocked for more than 5 seconds, the ANR dialog appears. How do we fix this? Well first, we need to analyze when the main thread blocks the UI from the Play Console report, then fix the code and upload the new build in the Play Console accordingly (heads-up: most cases of ANR occur during network operation, query execution and complex calculation, and they prevent the user from providing input in the app).
- Battery drain and wake lock: As goes without saying, we need to be careful that the app does not consume much battery life. Thankfully, the Battery Historian tool provided by Android Studio helps us cut the code into pieces, execute it in different time frames and analyze partial wake locks and background processes. If we have a wake lock issue, we can optimize it using the
WakefulBroadcastReceiverorJobSchedulertasks. - Background Network Usage: We can check network usage using
Network Profilerin Android Studio, or once again we can useJobScheduler. - Native code and JNI Issues: When dealing with Java Native Interface (JNI) issues, we need to debug crashes from C++/NDK code. Google Play Console native crash reports help to optimize the issue, and we can use
ndk-stackto symbolize the crash logs from the native library. - UI render and frame drops: Poor UI performance leads to frame drops – simple. But there’s plenty we can do here. After analyzing a UI report from the rendering section of the Android vitals dashboard, we can use
GPU Profilerto detect UI overflow. We have to analyzeChoreographer logsto measure the frame rendering time.7
As general points of good practice, it’s advisable to use SVG images instead of PNG or JPEG images (SVG images reduce out-of-memory errors), and handled runtime permissions properly. Specifically, we need to be careful that users cannot skip the permission dialog.
Finally, let’s look at different metrics and edge cases
One of the great things about Android Vitals is that we can use it to measure different metrics and plan for edge cases. This will help us carry out deep debugging and fix issues, while metrics data helps to categorize issues and priorities.
Here are some possible edge cases that we should anticipate and fix proactively, to ensure our apps are error-free and maintain that precious Play Store ranking.
- Slow networks or repeated network calls cause the ANR dialog.
- Large bitmap image processing in low-memory devices causes out-of-memory errors.
- App start-up will be delayed because lots of operations are on the
onCreate()method. - The app will hang when too many SDKs initialize at app launch.
- If the app wakes up on the device too frequently, it will drain too much battery.
- Continuous location updating in the background will cause high battery consumption.
- Complex UI or animation requires too much time to render frames.
- Nested
RecyclerViewscause slow performance in the app. - An API request with retry options, or an API running on the main thread, will cause the ANR dialog.
- Downloading large images or videos blocks the UI.
- If Android 6.0 permissions are denied, this can affect app functionality and lead to increased crash frequency.
Android Vitals FAQ
What is Android Vitals and why is it important for app developers?
Android Vitals is a Google Play tool that tracks app performance, crashes, and battery usage. Monitoring it helps developers fix issues and improve app stability, which can boost Google Play rankings.
How can I access Android Vitals in the Google Play Console?
To access Android Vitals, go to the Play Console, select your app, and navigate to Monitor and improve > Android Vitals > Overview. You’ll see metrics like crash rate, ANR rate, and battery usage.
Do I need to add code to use Android Vitals in my app?
No, Android Vitals collects data automatically. You don’t need to add code—just upload your app to the Play Store and Google handles the rest through the Play Console.
What does ANR rate mean in Android Vitals?
The ANR (Application Not Responding) rate shows how often your app’s UI thread is blocked for more than 5 seconds. High ANR rates hurt user experience and affect app rankings.
How can I fix battery drain issues highlighted in Android Vitals?
To fix battery drain, use tools like Battery Historian or JobScheduler. Look out for wake locks, background WiFi scans, and frequent background activity—all of which can drain battery fast.
What causes slow UI rendering in Android apps?
Slow UI rendering happens when frames take too long to render. Common causes include complex layouts, animations, or nested RecyclerViews. Use GPU Profiler and Choreographer logs to spot these issues.
How does Android Vitals affect my app’s ranking on Google Play?
Google uses Android Vitals data to rank apps. Apps with fewer crashes, better battery use, and smoother UI are more likely to appear higher in Play Store search and recommendations.
And we’re done!
Well, almost. Before we go, let’s summarize what we have learned today, from app creation to app publishing in the Play Store.
- We need to regularly follow up on the Android Vitals report and continuously fix crashes for a better user experience and optimal Google Play ranking.
- During app development, we need to remember the above edge cases and develop the app accordingly.
- We should think about the user experience at all times. User permissions provide a prime example; even a slight error with permissions can have a major impact on the overall look and feel of our app.
Any other questions? Just write to us. We’re always happy to chat about Android Vitals or any other Android topic. So whatever questions you’ve got, we’re hear to chat.
Happy Coding!
Expect The Unexpected!
Debug Faster With Bugfender

Anupam Singh
Anupam Singh is a Native Android Developer as well as Hybrid Mobile App Developer. More than 10 years of experience in Developing Mobile Apps. He is a technology blogger. Follow him on Linkedin to stay connected.