7 Minutes
Android Studio and Xcode App Debugging With Breakpoints: How to From Zero
Fix Bugs Faster! Log Collection Made Easy
To kick off our series on debugging for software developers, we tell you how to build breakpoints step by step using Xcode and breakpoint Android Studio to isolate key information about your app’s performance, and save crucial time during the process.
Level: beginner
Platform: iOS/Android
Reading time: 10 minutes
Ok first of all, what’s a breakpoint on iOS and Android ecosystem?
To answer this question, let’s take a little trip down memory lane.
In my first-ever computer programming tutorial (called, very imaginatively, Initiation to Programming), we wrote an algorithm in Pascal to perform a series of simple operations, like printing the sum of two numbers to the console.
Once written, we pressed the execute key and waited for the result. It came back like this:
var
num1, num2: Integer;
begin
// A simple program for adding two numbers.
WriteLn('The result is: ', num1 + num2);
end.
Soon, questions began rattling around my head (and not just about why the tutor made us use a programming language which was used to code the Apple II 40 years ago).
As the algorithms became more complex, and started calculating things like the greatest common divisor, I began getting unexpected outcomes. The output of the console started coming up incorrect.
Then it hit me. I was writing my first bugs.
At that moment I barely knew what the word ‘debug’ even meant, so I did what all programmers do. I added some logs to my code to understand what was happening (AKA Writeln() everywhere).
The output of my console would now be something like:
$ Now I'm in the iteration 3 of the while loop
$ Var num1 has value: 7
$ Var num2 has value: 15
Writing that bunch of logs was helpful to understand the current state of the program execution and to find bugs. However, it wasn’t very practical. If, for example, you forget to print the result of a variable, you would need to re-write, re-compile and re-run the program.
Wouldn’t it be amazing if you could pause the program execution and print the value of all the variables? Well, it turned out someone had already thought of this.
That’s exactly what a breakpoint is. Thanks to the miracle of the breakpoint, app developers can pinpoint a specific point in their program and tell their IDE to “pause the program here and capture the value of every variable”.
Note: If you are using USB debugging with your device or remote debug with your phone, ipad, tablet, etc, this applies in the same way.
Here’s an example from Xcode.
Here you can see that Xcode has paused the execution on line 31 and, in the lower pane, you can inspect the list of the stored values.
(At this point it’s worth mentioning that you should still have a good logging strategy, irrespective of breakpoints. Don’t worry, we’ll cover this in future chapters).
Debugging app for Android and iPhone
How to set up a breakpoint on Android Studio and XCode
Ok, so now let’s create your first breakpoint. Xcode and Android Studio both offer amazing options to get started; in fact, their debuggers are essentially the same.
The debugger allows mobile app developers to examine variables in real time and carry out much more sophisticated operations like evaluating expressions, modifying values during execution, and following the execution flow step by step.
To set up your breakpoint, you simply need to open a project in Xcode or Android Studio, and click close to the code line number.
That’s how it looks in Xcode. You’ll see a blue arrow appear, indicating that the execution will pause when it reaches that point.
In Android Studio you can do exactly the same, but the debugger will not work by default. You need to press the button on the right, which shows a small bug, instead of the “Play button” on the left, to ensure that you are attaching the debugger.
The result will be pretty much the same as it is in Xcode. Once the point you’ve marked is reached, the program execution will stop and you will be able to check the values of all the variables.
Follow the program flow
Nowadays, every debugger will pause to check the program state whenever a breakpoint has been reached: it’s a basic and universal tool. But there is another feature that programmers find very useful. It’s called Step By.
Once the execution of a program has been paused and all the variables inspected, you may want to know what happens when the execution continues. In case you are using software like React Native, Xamarin, Unity or Ionic the behaviour it’s similar.
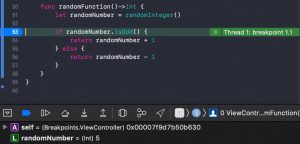
Let’s take an example. Imagine you’re building your app and you need to debug this piece of code, which takes a random integer and returns a different number depending on whether the value is odd or even.
This code is returning unexpected results, so you start your debug session by setting a breakpoint at line number 53 to check whether the random integer is correctly returned.
Now you know that randomNumber has a value of 5, you probably want to ensure that your program execution continues into the ‘if’ sentence of the following ‘if-else’.
To do this, you could set new breakpoints in the lines 54 and 56, resume the execution and inspect the values all over again.
But there’s a more efficient way. The debugger allows you to “navigate” step by step in the execution of the program.
Just press the Step Over button and check how your execution has advanced to the next line that will be executed.
This is how you do it in Xcode.
Unexpectedly, the code has continued into the ‘else’ function, which indicates that the function “isOdd()” contains a bug.
This example can seem pretty trivial with one ‘if-else’ condition. But imagine a ‘switch’ sentence with 30 options or an ‘if-elseif-elseif-…-else’ chain. You don’t want to set 30 breakpoints or conditional breakpoints.
But there’s more.
The Xcode/Android Studio debugger doesn’t just allow you to Step Over into the next line. You can also go inside a function, Step Into, or advance to the next line outside the current method, Step Out. Or you can use the Xcode debugger commands directly or Android Studio LLDB.
If you’re like most developers, you’re probably working against the clock (with the sheer number of apps being released every day, tight deadlines are a fact of coding life). But it’s still worth taking these panes in Xcode and Android Studio and experimenting with them. They look the same and they are the same. You will be surprised at how much time you save once you’ve mastered these pretty basic functions of the debugger.
What’s next?
Ok, that’s the end of our introductory breakpoint tutorial. But don’t worry, there’s plenty more to come. Inspecting a piece of code is just the most basic use of your debugger. There is so much more you can do.
In the next chapter we will continue talking about breakpoints, but we will also immerse ourselves in a totally new world. We’ll pause the execution of the code when a condition occurs, change the value of a variable during execution, trigger a breakpoint when a method from an internal class is called, attach debugger to an android process and iOS and Android remote device debug.
See you soon. Happy debugging!
Related Content
You may be also interested in the following article, that will teach you on how to use ADB to debug your Android applications.
Mastering ADB: The Ultimate Guide to Debugging Your Android Applications
Expect The Unexpected!
Debug Faster With Bugfender


