Recommended Reading

15 Minutes
Best Mobile Crash Reporting Tools in 2025 (Free & Paid)
Fix Bugs Faster! Log Collection Made Easy
Overview of mobile crash reporting tools
Mobile crash reporting keeps apps reliable at scale, helping developers root out the cause of problems and prevent them recurring.
In this guide, we compare the top mobile crash reporting tools for 2025, including Android-friendly and cross-platform options, to help you choose the right fit for your workflow.
You’ll find:
- A quick summary of the best crash reporting tools and what each is best for.
- A feature comparison covering remote logging, feedback, and analytics.
- A pricing breakdown that looks beyond headline costs.
- Selection factors to help teams pick the right tool.
- Alternatives and FAQs about mobile crash analytics and reporting.
This guide focuses on what truly matters for real development teams, not just feature lists.
And yep, we’re slightly biased, as one of the solutions is our own. But we’ll try and be as fair and objective as we can.
Quick summary: Top mobile crash reporting tools (2025)
| Tool | Overview |
|---|---|
| Bugfender | Remote logging and crash reporting with in-app feedback and secure log storage. Best for: developers who need full visibility, even without crashes. |
| Firebase Crashlytics | Google’s lightweight crash tracking tool, with real-time alerts and user metrics. Best for: teams using the Firebase ecosystem. |
| Sentry | Open-source error and performance monitoring with rich integrations. Best for: teams needing flexibility and deep visibility. |
| Luciq (Instabug) | Crash reporting and in-app feedback for mobile apps with UX insights. Best for: QA and mobile teams focused on user experience. |
| Bugsnag | Stability and release tracking with detailed user impact analysis. Best for: apps with frequent updates that require stability monitoring. |
| Raygun | Cross-platform crash and performance monitoring with real-time alerts. Best for: teams managing web, mobile, and backend apps together. |
| New Relic | Full-stack observability with APM, backend, and mobile insights. Best for: large organizations needing complete visibility. |
| Splunk (AppDynamics) | Cisco’s APM platform with AI-powered monitoring and diagnostics. Best for: enterprises managing complex, high-traffic systems. |
Mobile crash reporting tools: A detailed comparison
Bugfender: Remote logging and pre-crash debugging
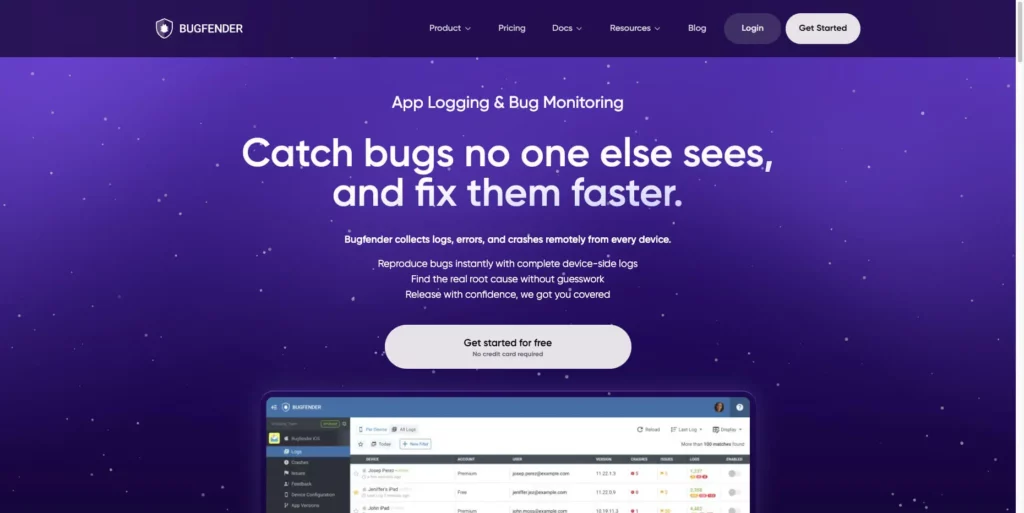
Yep, we’ll start about our own solution first. Because, well… it’s our post, right?
Bugfender helps developers understand what really happens inside their apps. It records user activity and technical logs in real time, even when the app doesn’t crash, giving teams the visibility needed to reproduce issues, fix bugs faster, and deliver more stable experiences.
| Bugfender | |
|---|---|
| Key Features | • Collects remote logs in real time from user devices for easier debugging. • Generates detailed crash reports with stack traces and device info. • Offers in-app feedback with screenshots and annotations. • Includes log filtering, search, and encryption for privacy. • Integrates with Jira, Slack, and Trello for quick issue tracking. |
| Pros | • Full visibility into app behavior even when there’s no crash. • Context-rich logs make debugging faster and more accurate. • Simple SDK integration for iOS, Android, and web. • In-app feedback improves UX and issue reporting. |
| Cons | • No built-in performance monitoring tools. • Less suitable for large-scale or enterprise apps. |
| Best for | Developers who need real-world debugging visibility and remote log access to understand app issues quickly. |
Firebase Crashlytics: Android-friendly crash reporting
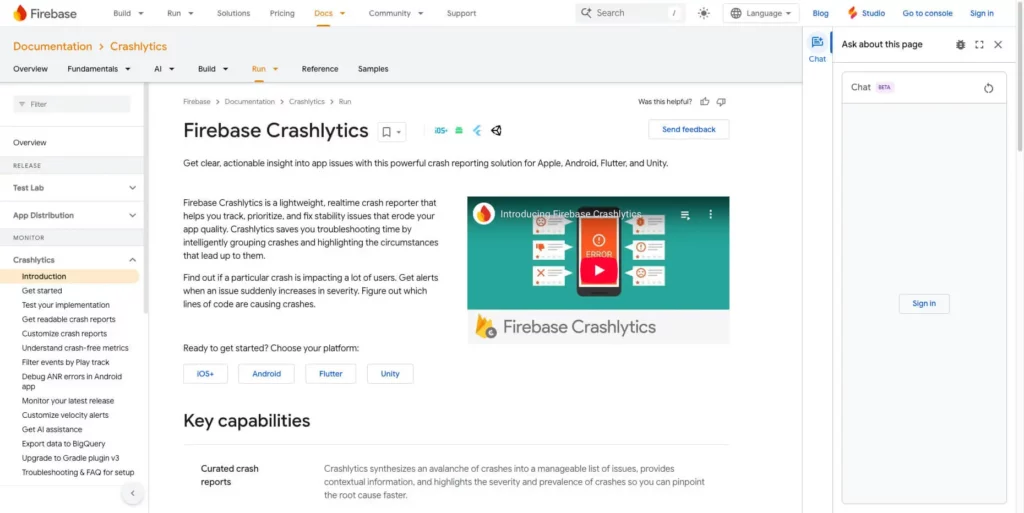
Firebase Crashlytics is a well-known crash reporting tool provided by Google as part of its Firebase suite. And it’s another extremely solid choice.
This enables real-time crash reporting, a tool that allows developers to trace and prioritize stability issues that may impact the user experience of their mobile applications. Firebase Crashlytics is lightweight and simple in terms of integration, while providing detailed crash data.
| Firebase Crashlytics | |
|---|---|
| Key Features | • Tracks detailed crash logs to pinpoint the cause of crashes. • Displays crash-free user metrics and behavior charts over time. • Captures stack traces, device state, and user steps before crashes. • Groups similar crashes to identify repeated issues faster. • Allows adding custom keys and logs for extra debugging context. |
| Pros | • Real-time crash alerts with clear, detailed reports. • Simple setup with Firebase integration. • User-friendly dashboard for quick issue management. • Reliable and stable performance for most mobile projects. • Generous free tier for small teams and indie developers. |
| Cons | • May feel overwhelming for beginners. • Limited customization compared to advanced tools. • Works best within the Firebase ecosystem and less suited to standalone use. |
| Best for | Developers who want fast, reliable crash reporting with seamless Firebase integration. |
Sentry: Open-source crash tracking and performance monitoring
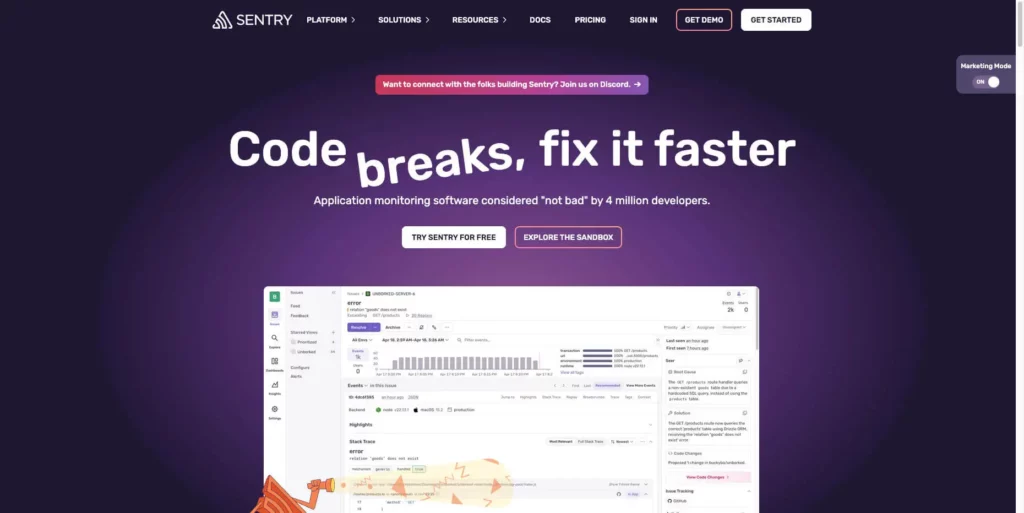
Sentry is an open-source error tracking and performance monitoring platform.
It helps developers detect, diagnose, and fix crashes in real time, offering detailed error context and integrations with popular development tools.
| Sentry | |
|---|---|
| Key Features | • Sends instant alerts when crashes or errors occur. • Provides full stack traces and variable data for quick debugging. • Groups similar errors to reduce noise and reveal recurring issues. • Tracks performance metrics like response times and throughput. • Supports breadcrumbs to log user and system actions before crashes. • Integrates with GitHub, Jira, and Slack for smoother team workflows. |
| Pros | • Combines crash reporting with performance monitoring. • Delivers detailed error reports for faster fixes. • Flexible and supports many programming languages. • Strong integrations with development and project tools. • Widely adopted, open-source, and reliable for most teams. |
| Cons | • Setup can be complex for new users. • Costs can grow with larger teams or data volumes. • The wide range of features may feel overwhelming initially. |
| Best for | Teams that need open-source flexibility and deep visibility into errors and performance across multiple platforms. |
Luciq (formerly Instabug): In-app feedback and mobile observability
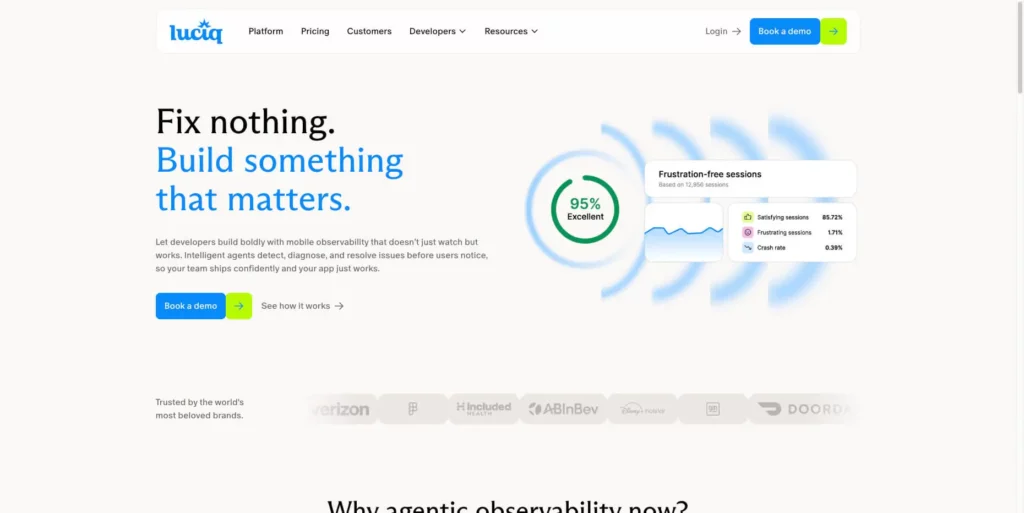
Luciq, formerly known as Instabug, is now positioned as a full mobile observability platform that helps teams monitor app health, stability, and user experience in real time.
It combines automatic crash detection, in-app user feedback, and AI-driven insights to help developers detect, understand, and resolve issues faster.
| Luciq | |
|---|---|
| Key Features | • Automatic crash capture with detailed stack traces, device data, and user context. • In-app feedback and bug reporting with screenshots, annotations, and screen recordings. • AI-assisted issue grouping and prioritization to surface the most impactful bugs. • Real-time monitoring of crash-free sessions and app stability trends. • Diagnostic logs and network data to reproduce issues quickly. • Integrations with Jira, Slack, Trello, GitHub, and other dev tools. • Supports iOS, Android, Flutter, and React Native. |
| Pros | • Combines crash analytics, bug reporting, and performance visibility in one platform. • AI-powered insights highlight critical issues automatically. • Strong integrations streamline issue tracking and communication. • Modern UI and SDKs designed for mobile-first workflows. |
| Cons | • Premium pricing tiers can become costly for larger apps. • Initial setup and integration may take time for new teams. • Broad feature set may require onboarding to use effectively. |
| Best for | Mobile teams seeking a unified, AI-driven platform for crash tracking, feedback, and performance monitoring across the entire app lifecycle |
BugSnag: App stability and error insights
BugSnag helps developers monitor and improve app stability by capturing and analyzing crashes across mobile, web, and backend platforms.
It provides detailed visibility into how errors impact users and helps prioritize fixes that deliver the greatest stability improvement.
| Bugsnag | |
|---|---|
| Key Features | • Captures and reports crashes instantly, giving detailed stack traces and user context. • Automatically groups related errors to highlight important trends. • Tracks user impact metrics to prioritize fixes that affect the most users. • Includes release and version tracking to pinpoint the point when bugs originate. • Integrates with Jira, GitHub, Slack, and other development tools. |
| Pros | • Clean, intuitive dashboard for quick error analysis. • Detailed, contextual reports that speed up debugging. • Real-time notifications for critical errors. • Excellent integrations with popular project management and CI/CD tools. • Supports a wide range of languages and platforms. |
| Cons | • Pricing rises significantly for larger teams and event volumes. • Setup can be complex for beginners. • Some features require time to fully learn and configure. |
| Best for | Teams that need reliable stability monitoring and error tracking across multiple platforms with deep release visibility. |
Raygun: Deep performance and crash analytics
Raygun is a cross-platform crash and performance monitoring solution for mobile, web, and backend applications.
It helps developers detect errors, measure performance, and gain actionable insights into how real users experience their software.
| Raygun | |
|---|---|
| Key Features | • Generates detailed crash reports with stack traces, user context and environment details. • Sends instant alerts for errors and exceptions so teams can respond quickly. • Tracks application performance metrics like response time, throughput, and server health. • Groups similar errors automatically to reduce noise and improve focus. • Provides custom dashboards and filtering tools for targeted issue tracking. • Integrates with Jira, Slack, Bitbucket, and other collaboration platforms. |
| Pros | • Intuitive dashboard with real-time visibility into app health. • Detailed error diagnostics with full user context. • Easy integration across multiple platforms. • Reliable alerts for fast response and resolution. • Works well for both small and enterprise-scale applications. |
| Cons | • Pricing can grow with large-scale usage. • Fewer customization options compared to some competitors. • Slight performance overhead when using monitoring agents. |
| Best for | Development teams seeking real-time crash tracking and performance insights across web, mobile, and server environments. |
New Relic: Full-stack observability for mobile and backend
New Relic is a full-stack observability and performance monitoring platform.
It provides real-time visibility across mobile, backend and infrastructure layers, helping teams identify errors, performance bottlenecks and user-impacting issues before they escalate.
| New Relic | |
|---|---|
| Key Features | • Detects crashes and errors in real time with detailed diagnostic data. • Monitors application performance metrics such as response time, throughput, and resource usage. • Groups and visualizes errors and stack traces to speed up troubleshooting. • Provides end-to-end visibility across distributed systems, APIs and user sessions. • Sends alerts via email, Slack, or news feed for quick response. • Integrates seamlessly with CI/CD pipelines to identify issues early in development. |
| Pros | • Combines APM, infrastructure and user monitoring in a single platform. • Real-time insights into crashes and performance trends. • Powerful dashboards for data visualization and analysis. • Integrates with a wide range of developer and DevOps tools. • Scales from small applications to enterprise environments. |
| Cons | • Not specifically tailored to mobile-first teams. • Steeper learning curve due to enterprise-level features. • Can be expensive for large teams with extensive data needs. |
| Best for | Development and DevOps teams that need a unified view of app performance, reliability, and infrastructure health. |
Splunk AppDynamics: Enterprise-grade performance and crash monitoring
Splunk AppDynamics (formerly Cisco AppDynamics) is now part of Splunk’s Observability Cloud, combining deep application performance monitoring (APM) with full-stack visibility.
Splunk uses AI-driven analytics to detect performance issues, trace root causes, and optimize both user experience and backend systems — ideal for enterprise environments running complex, high-traffic applications.
| Splunk AppDynamics | |
|---|---|
| Key Features | • Real-time performance and crash monitoring across apps, servers and databases. • AI-powered anomaly detection to flag unusual behavior early. • Code-level diagnostics for precise root cause analysis. • End-to-end visibility, from user interactions to backend infrastructure. • Business transaction tracking to monitor performance in context. • Integrations with CI/CD and DevOps pipelines via Splunk Observability Cloud. |
| Pros | • Combines enterprise-grade APM and crash monitoring. • Uses AI for smarter, faster troubleshooting. • Scales well for large distributed systems. • Strong visual dashboards and analytics. |
| Cons | • Complex setup for smaller teams. • Heavier agent instrumentation can impact performance slightly. • Premium pricing focused on enterprise budgets. |
| Best for | Large enterprises and DevOps teams needing AI-driven, end-to-end observability across applications and infrastructure. |
Mobile crash reporting tool alternatives: an overview
Not every team will want a crash reporting tool. Some teams will prefer an app performance solution, which allows them to proactively monitor usability or performance issues before they turn into crashes.
Here are some of the most popular options:
- UXCam: focuses on session replay and user behavior analytics, helping visualize real interactions and friction points.
- Embrace: provides mobile observability and performance tracking, combining crash data with session insights.
- Datadog Mobile RUM: integrates real user monitoring with backend performance metrics.
- Smartlook: records sessions and events to analyze crash causes from a UX perspective.
From a personal perspective, we’d recommend a combination of crash reporting and proactive analysis. Several of the crash reporting tools covered in this article offer both services.
How to choose the right crash reporting tool
The best crash reporting tool for your business will provide a blend of performance, clarity and scalability. Here are the key factors to consider:
- Ease of setup and integration. How quickly can you implement it without disrupting your workflow?
- Lightweight SDK and performance impact. Does it affect app speed or stability once integrated?
- Crash accuracy and log detail. Does it capture reliable, real-time data with enough context to reproduce issues?
- Analytics and collaboration. Can you track trends and share insights easily across your team?
- Scalability and cost. Will it remain affordable and efficient as your app and user base grow?
- Privacy and data control. Does it give you control over what data is collected and how it’s stored?
Ultimately, a good tool should simplify debugging today and still fit your stack tomorrow.
Crash reporting tools pricing comparison (2025)
Pricing is usually the primary deciding factor when comparing crash reporting tools, and rightly so. But it’s worth looking beyond the headline monthly cost.
Lower tiers can be appealing, yet they often limit data retention, event volume, or collaboration features that growing teams need later. More complete plans tend to include real-time alerts, integrations and deeper analytics, which may save time and maintenance costs in the long run.
Here’s a more complete comparison so you can make your own mind up.
| Tool | Pricing Details |
|---|---|
| Bugfender | • Free forever: Unlimited users and apps, limited to 100k log lines/month, 7-day retention, and 2,000 devices. • Startup plan: From $59/month (or ~$42/month annual) with 10 million logs, 7-day retention, and unlimited devices, plus Slack, Jira and Trello integrations. |
| Firebase Crashlytics | • Free forever (with limits): Unlimited crash reports, but Firebase resources share quotas — most apps exceed Cloud Functions (2M calls/month) or Firestore (50K reads/day) early. • After that, the Blaze pay-as-you-go plan applies (~$25–$200/month for growing apps). |
| Sentry | • Free plan: Limited to 1 user, 5k events, and 10k transactions/month, with 30-day retention — fine for staging or low-traffic apps. • Team plan: From $26/month (annual) for 50k+ events, team collaboration, and longer retention. • Costs increase with event volume, retention, and additional users. |
| Bugsnag | • Free plan: Limited to 1 user, 7.5k events and 1M spans/month. • Standard plan: From $59/month, adding stability scores, release tracking, and impact metrics — higher tiers expand alerts and collaboration tools. |
| Luciq (Instabug) | • No public free plan: you must book a demo to get started. • Pricing model: Transparent plan based on Daily Active Users (DAU) and team seats, not usage-metered. • Scaling: Luciq tracks a 6-month rolling average of DAU and only upgrades plans if that average exceeds your tier. |
| Raygun | • Free trial: 14 days’ full access. • Crash reporting: From $40/month per 10k events — APM sold separately (~$80/month) depending on data volume. |
| New Relic | • Free tier: 1 user, 100 GB/month of data ingest. • Paid plan: From $99/user/month, extending data retention and unlocking APM dashboards. |
| Splunk (AppDynamics) | • Free trial: 14 days full access. • Paid plans: Start at $15/month per host (annual) for core APM and infrastructure monitoring. • Higher tiers add AI-powered analytics, business transaction tracing, and RUM (Real User Monitoring) for complete observability. |
Why crash reporting alone isn’t enough
Crash reports show what failed, but not why it happened. Without deeper visibility, developers only see symptoms, not causes.
So, to truly understand app issues, teams need tools that go beyond the fact of the crash, and capture:
- Pre-crash context: Logs and events leading up to a failure reveal hidden patterns.
- User feedback: Real user input explains how issues affect experience.
- Performance metrics: Slowdowns and memory leaks often precede crashes.
- Remote logging: Helps reproduce hard-to-catch errors on real devices.
- Data correlation: Combining logs, feedback, and analytics will speed up debugging.
Crash reporting is essential, but pairing it with continuous logging and feedback tools gives the full picture.
Bugfender vs top mobile crash reporting tools
And finally, we thought we’d leave this here…
| Feature | Bugfender | Firebase Crashlytics | Sentry |
|---|---|---|---|
| Real-time crash reports | ✅ Yes | ✅ Yes | ✅ Yes |
| Remote logging (pre-crash data) | ✅ Included | ❌ No | ❌ No |
| In-app feedback | ✅ Built-in | ❌ Not available | ❌ Not available |
| Performance & UX insights | ⚪ Basic | ⚪ Basic | ✅ Advanced |
| Privacy controls & data ownership | ✅ Full control | ⚪ Limited | ⚪ Limited |
| Ease of setup | ✅ Simple SDK | ✅ Simple | ⚪ Moderate setup |
FAQs about mobile crash reporting tools
What is mobile crash reporting and how does it work?
Mobile crash reporting automatically records errors, crashes, and app failures that occur on users’ devices. It logs details like stack traces, device state, OS version, and user actions before the crash, then sends the data to a dashboard for analysis. This helps developers quickly detect and fix issues, making apps more stable, trustworthy, and user-friendly.
Key features typically include:
- Real-time crash detection and alerts
- Detailed logs and stack traces
- User impact and frequency analysis
- Performance and session tracking
- Integration with tools like Jira or Slack
Why do developers need crash reporting tools?
Without a crash reporting tool, developers rely on user complaints or guesswork to find issues — which could mean they waste time and miss bugs. Crash reporting tools automate that process by collecting actionable data whenever something goes wrong. They help teams:
Are there free crash reporting tools?
Free plans are great for small apps or MVPs, but they often limit data retention, event volume, or collaboration features. Growing teams usually upgrade once they need real-time alerts, integrations, or more detailed analytics.
How do mobile crash reporting tools affect performance?
Modern SDKs are designed to be lightweight and asynchronous, meaning they won’t block the main thread or slow the app noticeably. However, overly detailed logging or poor integration can increase memory use.
What’s the difference between logging and crash reporting?
Logging and crash reporting both record what happens inside an app — but they serve different purposes.
Do crash reporting tools work offline?
Yes. Most SDKs store crash data locally if the device is offline and send it automatically once the user reconnects to the internet.
Can crash reporting tools replace manual testing?
No. They complement QA processes but don’t replace them. Crash reports show what broke — not necessarily why users struggled or how to improve UX.
Final Thoughts on Mobile Crash Reporting Tools
Crash reporting tools help developers understand why apps fail and how users are affected, making them essential for building stable, reliable software.
When comparing tools, focus on:
- Real-time alerts and detailed diagnostics
- Root cause visibility with logs and stack traces
- User impact analysis and pre-crash context
- Integrations that match your workflow
Best picks by focus:
- Firebase Crashlytics – quick setup for Android apps
- Sentry / Bugsnag – solid for multi-platform and performance tracking
- Luciq (Instabug) – great for user feedback and UX insights
- Bugfender – adds remote logging and pre-crash debugging for deeper visibility
Choose the one that fits your workflow, scale, and budget best. Happy Debugging
Expect The Unexpected!
Debug Faster With Bugfender

Sachin Siwal
Sachin is an accomplished iOS developer and seasoned technical manager, combining 12 years of mobile app expertise with a knack for leading and delivering innovative solutions. You can contact him on Linkedin