10 Minutes
Conditional breakpoints: How to Debug iOS and Android apps from Zero (Part 2)
Fix Bugs Faster! Log Collection Made Easy
Conditional Breakpoints and their variants, Exception and Symbolic Breakpoints are powerful tools for advanced debugging, applicable to both iOS and Android. We’ll explore them in this article.
In the first post of our How to Debug from Zero series we learnt the basics of breakpoints. At this point, you should know how to add a new breakpoint and how to use the “step over”, “step in” and “step out” commands. These three concepts should save you a lot of time when debugging your app.
In this new chapter we’re moving to the next stage and will discuss a few tricks to help you improve your debugging flow still further.
Conditional Breakpoints
A conditional breakpoint is a breakpoint that works only when it is relevant, that is when certain conditions are met. In order to illustrate this, I created an algorithm in Swift that perfectly describes one of my brain’s background threads in the mornings.
We’ll see how to work with these, first on iOS, but read anyway if you’re an Android because it’s very similar.
Conditional Breakpoints on iOS
  func balanceEnergy(energy: Int) {
    if(energy < 60) {
        drinkCoffee()
    } else {
        drinkWater()
    }
  }

  func drinkCoffee() {
    print("Glup, glup, glup. I love coffee")
  }

  func drinkWater() {
    print("Glup, glup, glup. Hydration is good!")
  }
In this case we want to debug the function balanceEnergy, which ensures that my levels of hydration and caffeine are kept in the right balance.
We can proceed as we’ve seen in the previous chapter, setting up a breakpoint in Xcode and executing the app.
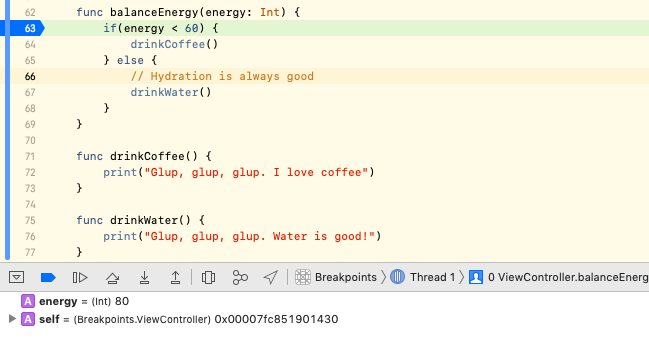
We can see in the debugger that the value of the variable energy is 80. If we continue the execution, the program will drink water.
Now, we will check the opposite condition. Given an energy value below 60 should launch the coffee routine, we will try again by simply repeating the process: we execute the routine again and the value of the variable energy is 79. Another try and the value is 78. Next time, 77.
[random-ad]
At this point we can execute the program a further 18 times until we reach the value 59 – or we can use a condition to trigger our breakpoint.
Just double click in the breakpoint and Xcode will show you a whole new world of possibilities.
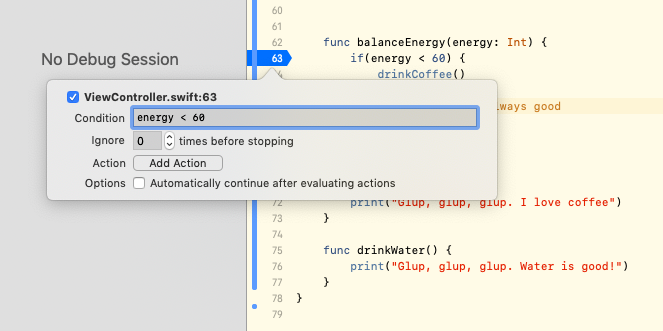
This little popup that appears on the screen allows you to modify a number of properties in the breakpoint. Notably, you can introduce the condition under which the breakpoint should pause the execution. In this case, we can specify that the energy level is lower than 60.
If we execute the program again, this time the breakpoint will be ignored until the condition is achieved and we won’t need to wait any longer.
Conditional breakpoints are especially useful when you are trying to find bugs that are only considered bugs under certain conditions. A typical use case in which a conditional breakpoint can help you could be detecting when your app is trying to reload data, despite the user not being logged in.
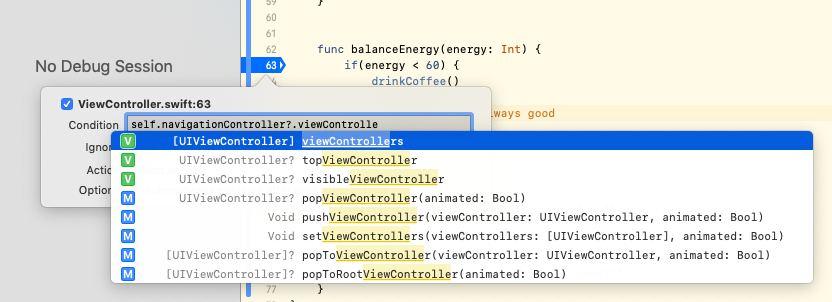
A cool thing about this type of breakpoint is that you can go as crazy as you want. You can write full instructions in that small Condition textfield, you can access all the individual app components – even if they’re not part of the breakpoint’s current context – and in general you can write whatever line of code makes sense in the context of the breakpoint. Xcode even provides you with the auto completion tool for it.
Do you want to enable the breakpoint only when you’re certain that View Controller is part of the view controllers stack? No problem.
Side node: when you write an instruction in your conditional breakpoint you are actually injecting code. If you write, for example
view.backgroundColor = .black, because you forgot to use==you will actually be changing the color of the view. Take this into account if you introduce very complex instructions. An innocent typing mistake might introduce lateral effects in your debugging session and create chaos (as you probably know, chaos is not good for debugging!!)
But there’s more. Did you notice that in the same small breakpoint popup there is an Add Action button?
To use it, simply open your editor, set up a breakpoint, press the Add Action button and then have fun experimenting. The possibilities are endless. You can launch console scripts, write debugger commands, ignore the breakpoint for a given number of times, execute actions without pausing the execution and plenty more besides.
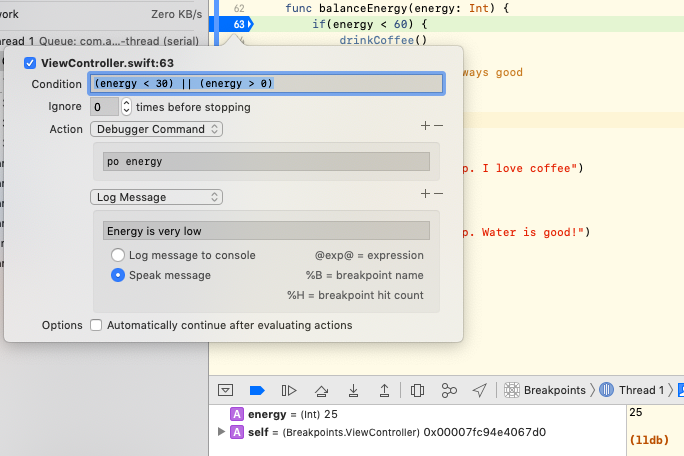
In the following example we have set up a breakpoint that:
- Stops the execution only when energy var is between 0 and 30
- Prints the value of the variable
- Reads a warning sentence (and yes, by “reading” I really mean that Xcode reads the sentence out loud).
Conditional Breakpoints on Android
If you are an Android developer and you are wondering whether you can do that in Android Studio, the answer is yes. As we mentioned in the previous chapter, it’s mostly the same.
You can set up a sample project and we will help you port our awesome algorithm from Swift to Kotlin. (ie: func → fun and print→ Log)
    fun balanceEnergy(energy: Int) {
        if(energy < 60) {
            drinkCoffee()
        } else {
            drinkWater()
        }
    }

    fun drinkCoffee() {
        Log.d("drinking", "Glup, glup, glup. I love coffee")
    }

    fun drinkWater() {
        Log.d("drinking", "Glup, glup, glup. Hydration is good!")
    }
Now you can set up the exact same breakpoint and right-click over it to open a very similar panel.

Just press More in the bottom-left corner and things will go wild again, but with the Android Studio flavor this time.
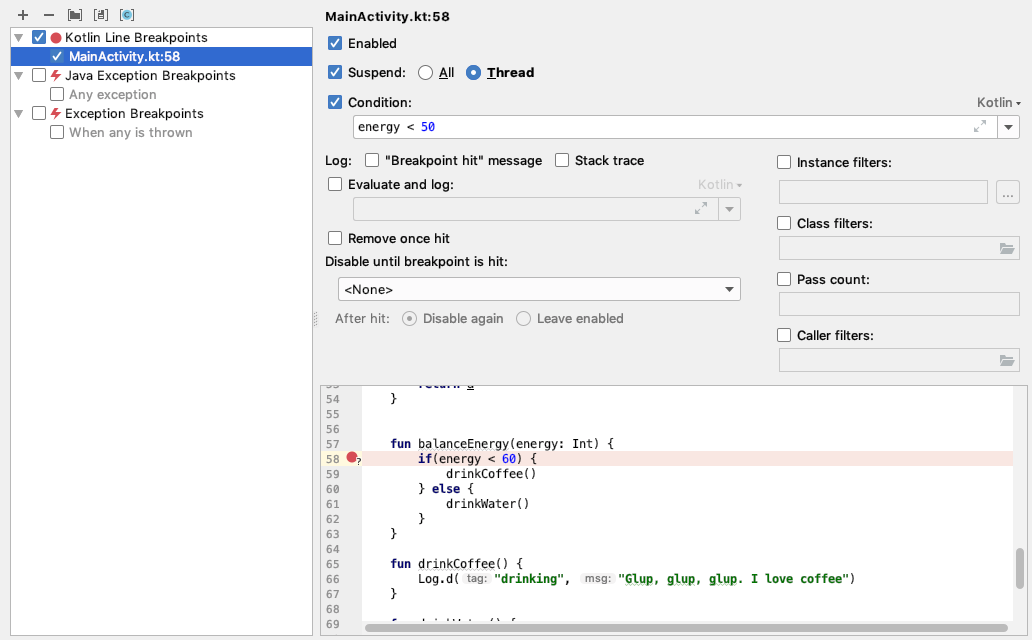
Again, it’s up to you to investigate this screen and to discover all the different options.
For now, we’re going to jump to the next point.
Exception breakpoints
Exception breakpoints are a variant of conditional breakpoints. The break condition is “when an exception is thrown”.
Exception breakpoints represent a very powerful debugging tool that – in my own experience – is often underestimated and sometimes even ignored by developers.
Until now, we have learnt that breakpoints were attached to a concrete line of code. Wherever we needed to debug a piece of code, we set a breakpoint. However, exception breakpoints will pause the execution when a problem is encountered anywhere in your program.
As we mentioned before, this is almost the same in Android and iOS. Let’s check how to do it in both environments:
Exception Breakpoints on iOS
In iOS, setting up an exception breakpoint is something trivial and exceptionally useful. Many of the Apple frameworks are written in Objective-C and C++ and when they throw an error the stack trace tends to not be very useful.
Let’s analyze how exception breakpoints can help us in those cases by using an example. Imagine the following code:
// Access to the first element of an empty array
id element = @[][1];
If you execute that code you will get an immediate crash and a useless stack trace like this one:

How can we get more information about the origin of this crash?
Press Cmd + 8 to show the breakpoints pane, click on the “+” icon in the bottom left corner and just add an Exception Breakpoint.
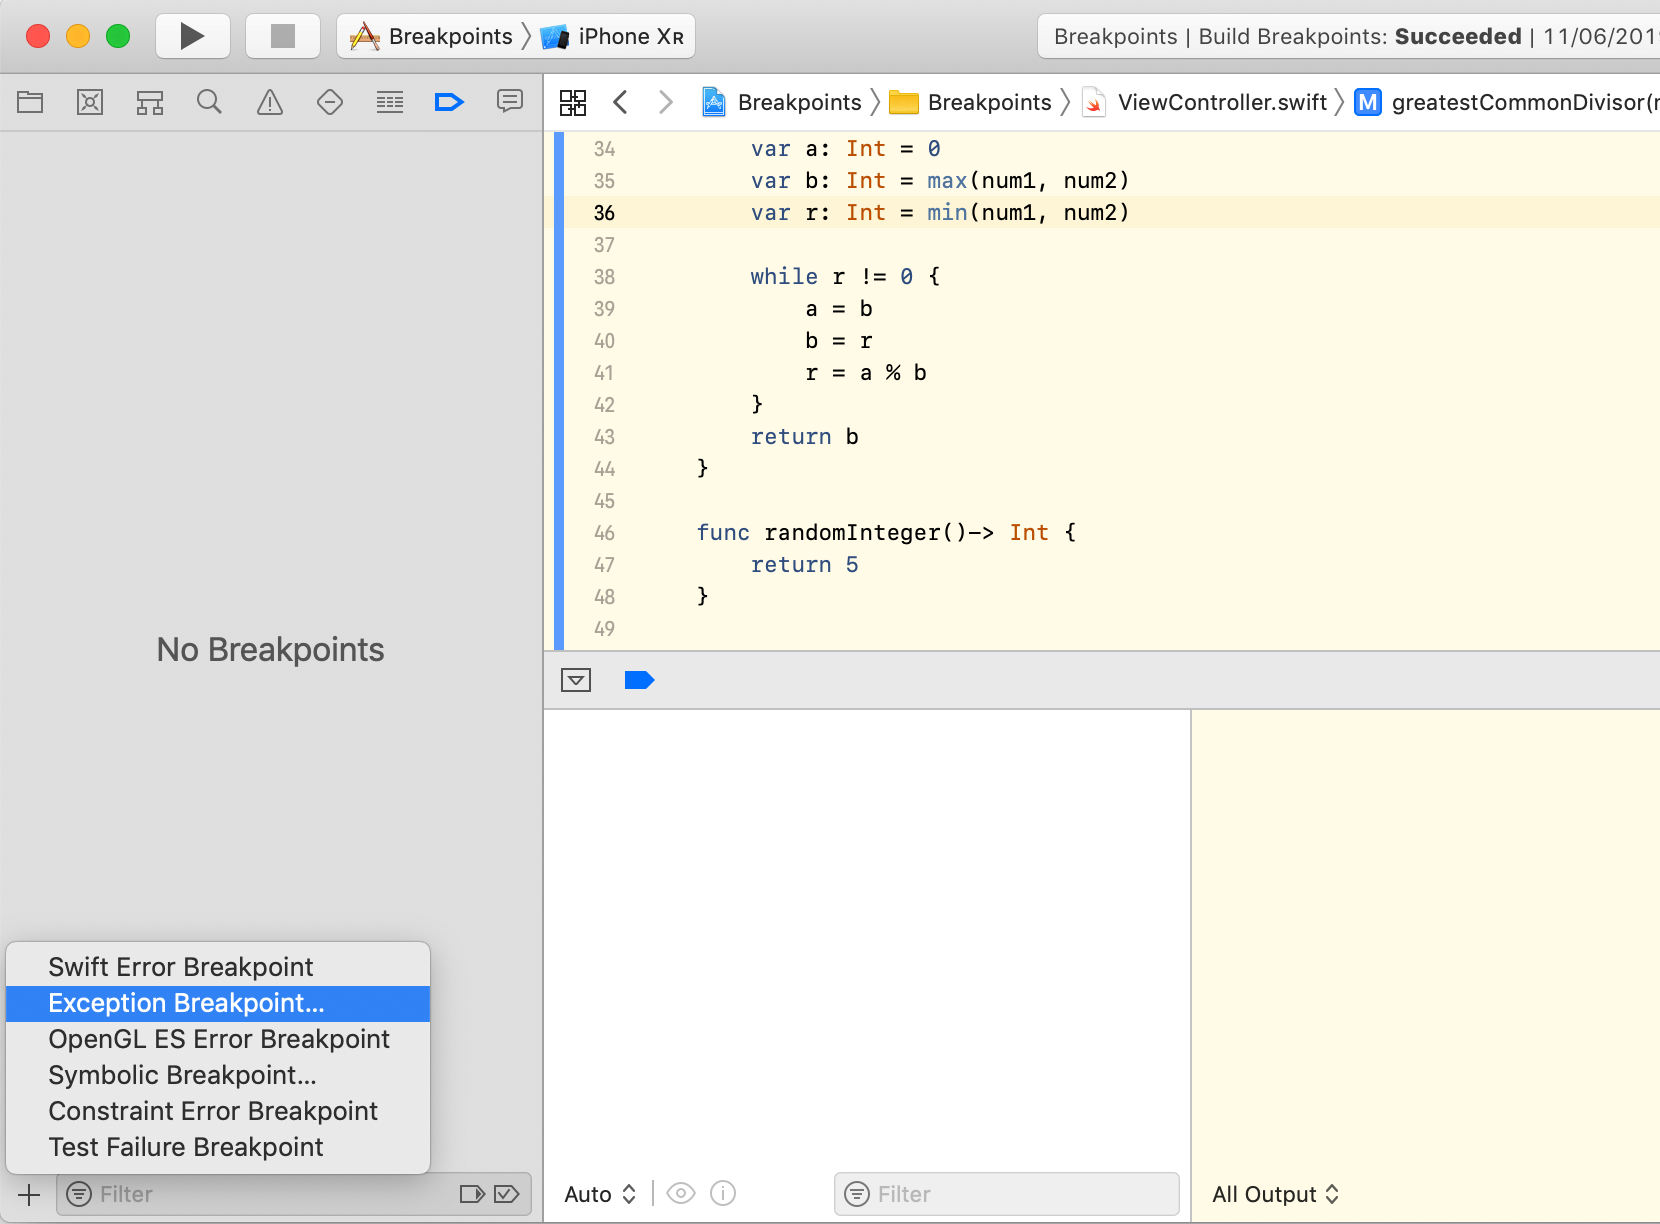
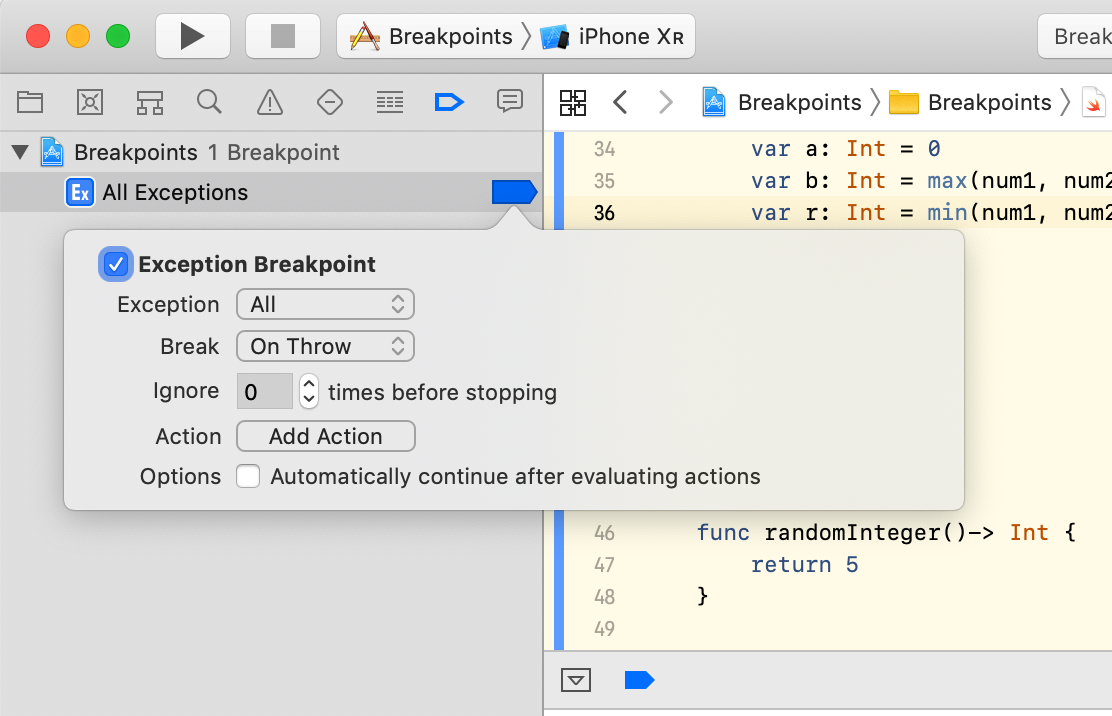
Like every breakpoint, the Exception Breakpoints can be configured with some additional options. The most important to remember is that you can choose C++/Objective-C exceptions and the moment in which the breakpoint should be triggered.
If we execute the code now, we will see that the Exception Breakpoint is showing much more information. The stack trace shows the exact problem and the program is paused at the exact line causing the problem.

Notice: when errors are properly handled and controlled, the app will not crash. During debugging this might be a problem because some errors might be unnoticed. For this reason, many developers have an Exception Breakpoint enabled in their projects all the time. In this way, whenever an error occurs, the program is interrupted and they will be aware – from a broken constraint to an incorrectly-formatted JSON. These are typical examples of bugs that are correctly managed and arrive to production.
Swift Error Breakpoints
In Swift, we can also use the Swift Error Breakpoint. It is the perfect complement to the Exceptions breakpoint. Unlike that one, the Swift Error breakpoint will be triggered only by your own code ignoring system or third-party frameworks.
This is useful because, in Swift, an error can be thrown by a method that is many levels deeper than the code you are debugging. A Swift Error Breakpoint will get the exact point in which the error was thrown.

Swift Error breakpoint is added in the same way as an Exception Breakpoint and can be configured to be triggered only by a concrete custom error or by all the errors.
Exception Breakpoints on Android
In Android we are going to go to the Run → Show Breakpoints menu and, as you’re probably expecting, we are going to get a window with very similar options. In this case you want to check Enabled, Suspend and All to get a behavior similar to the previous iOS example.
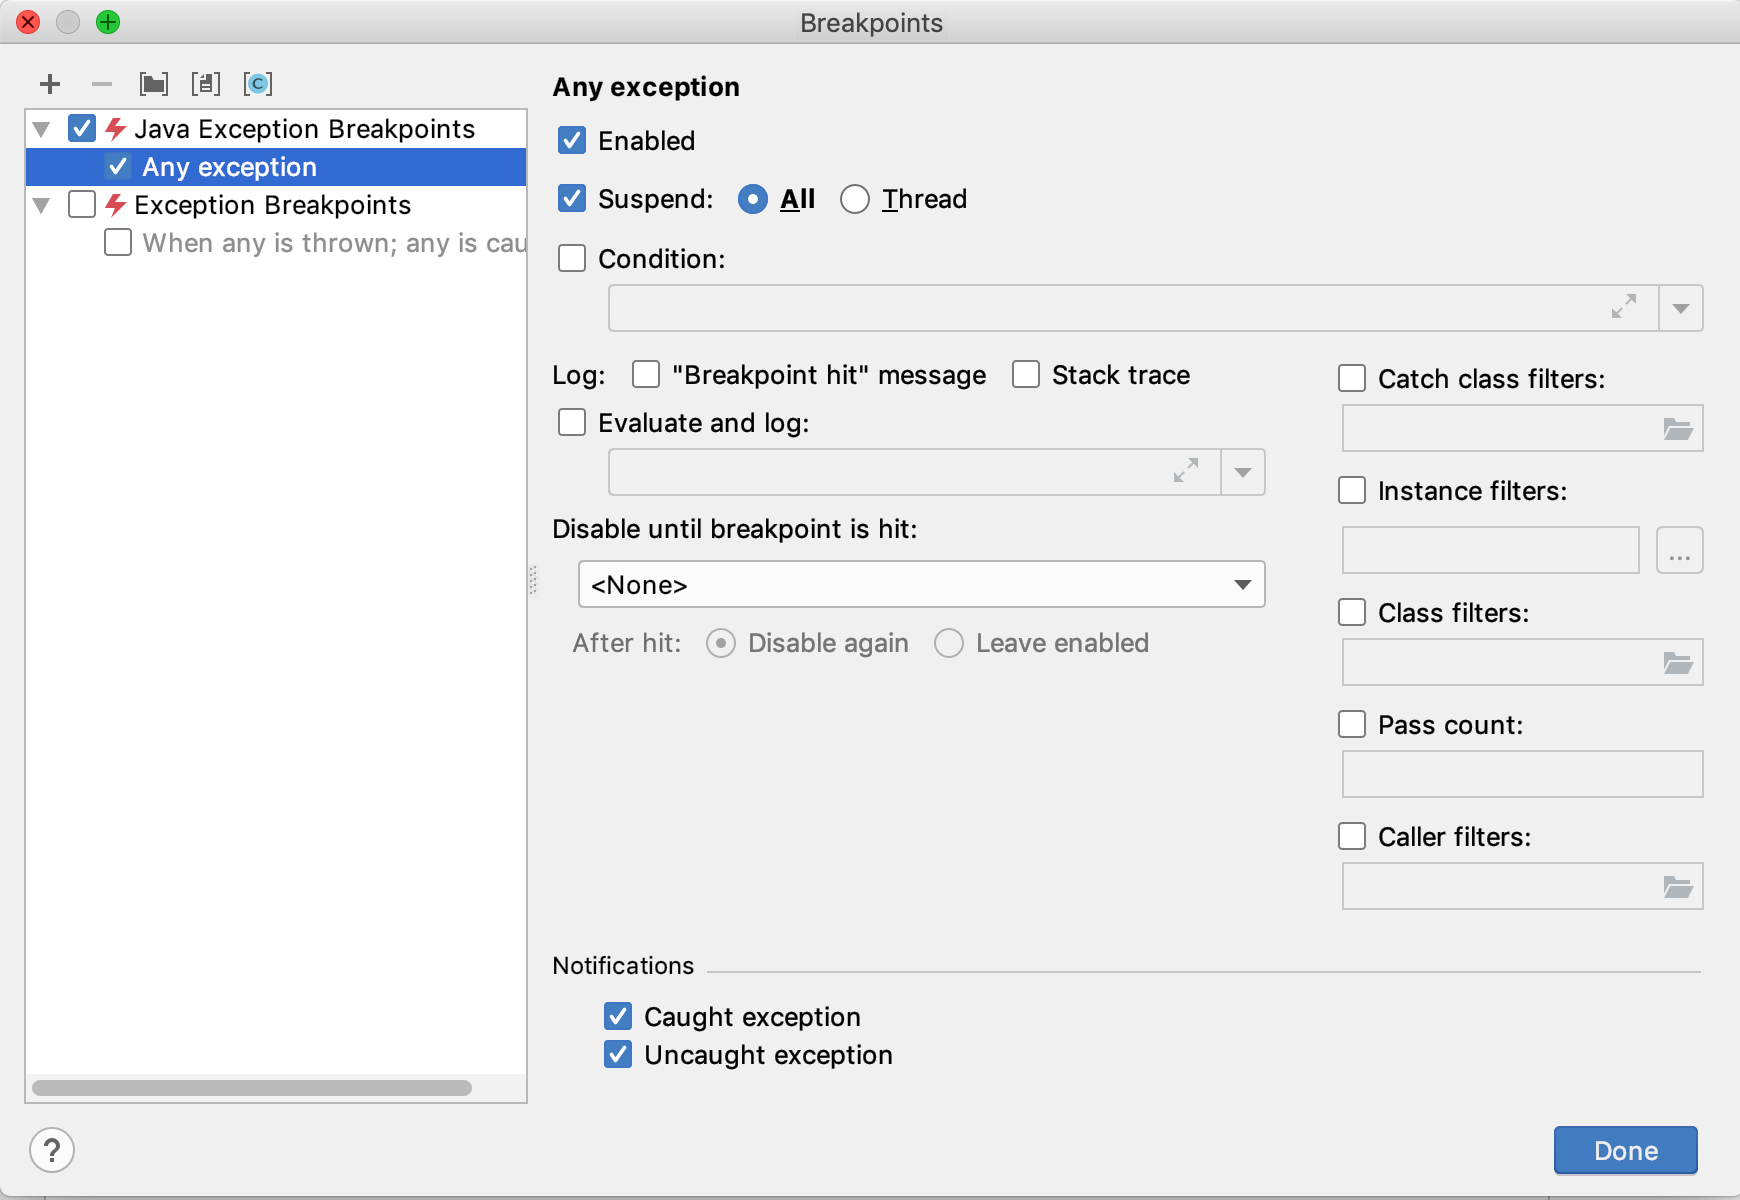
If we were to run a similar code to the example in the previous section, let’s say:
val array = arrayListOf<Int>()
val unexistentValue = array[1]
We would, once again, get a breakpoint and a useful stack trace allowing us to follow the error:
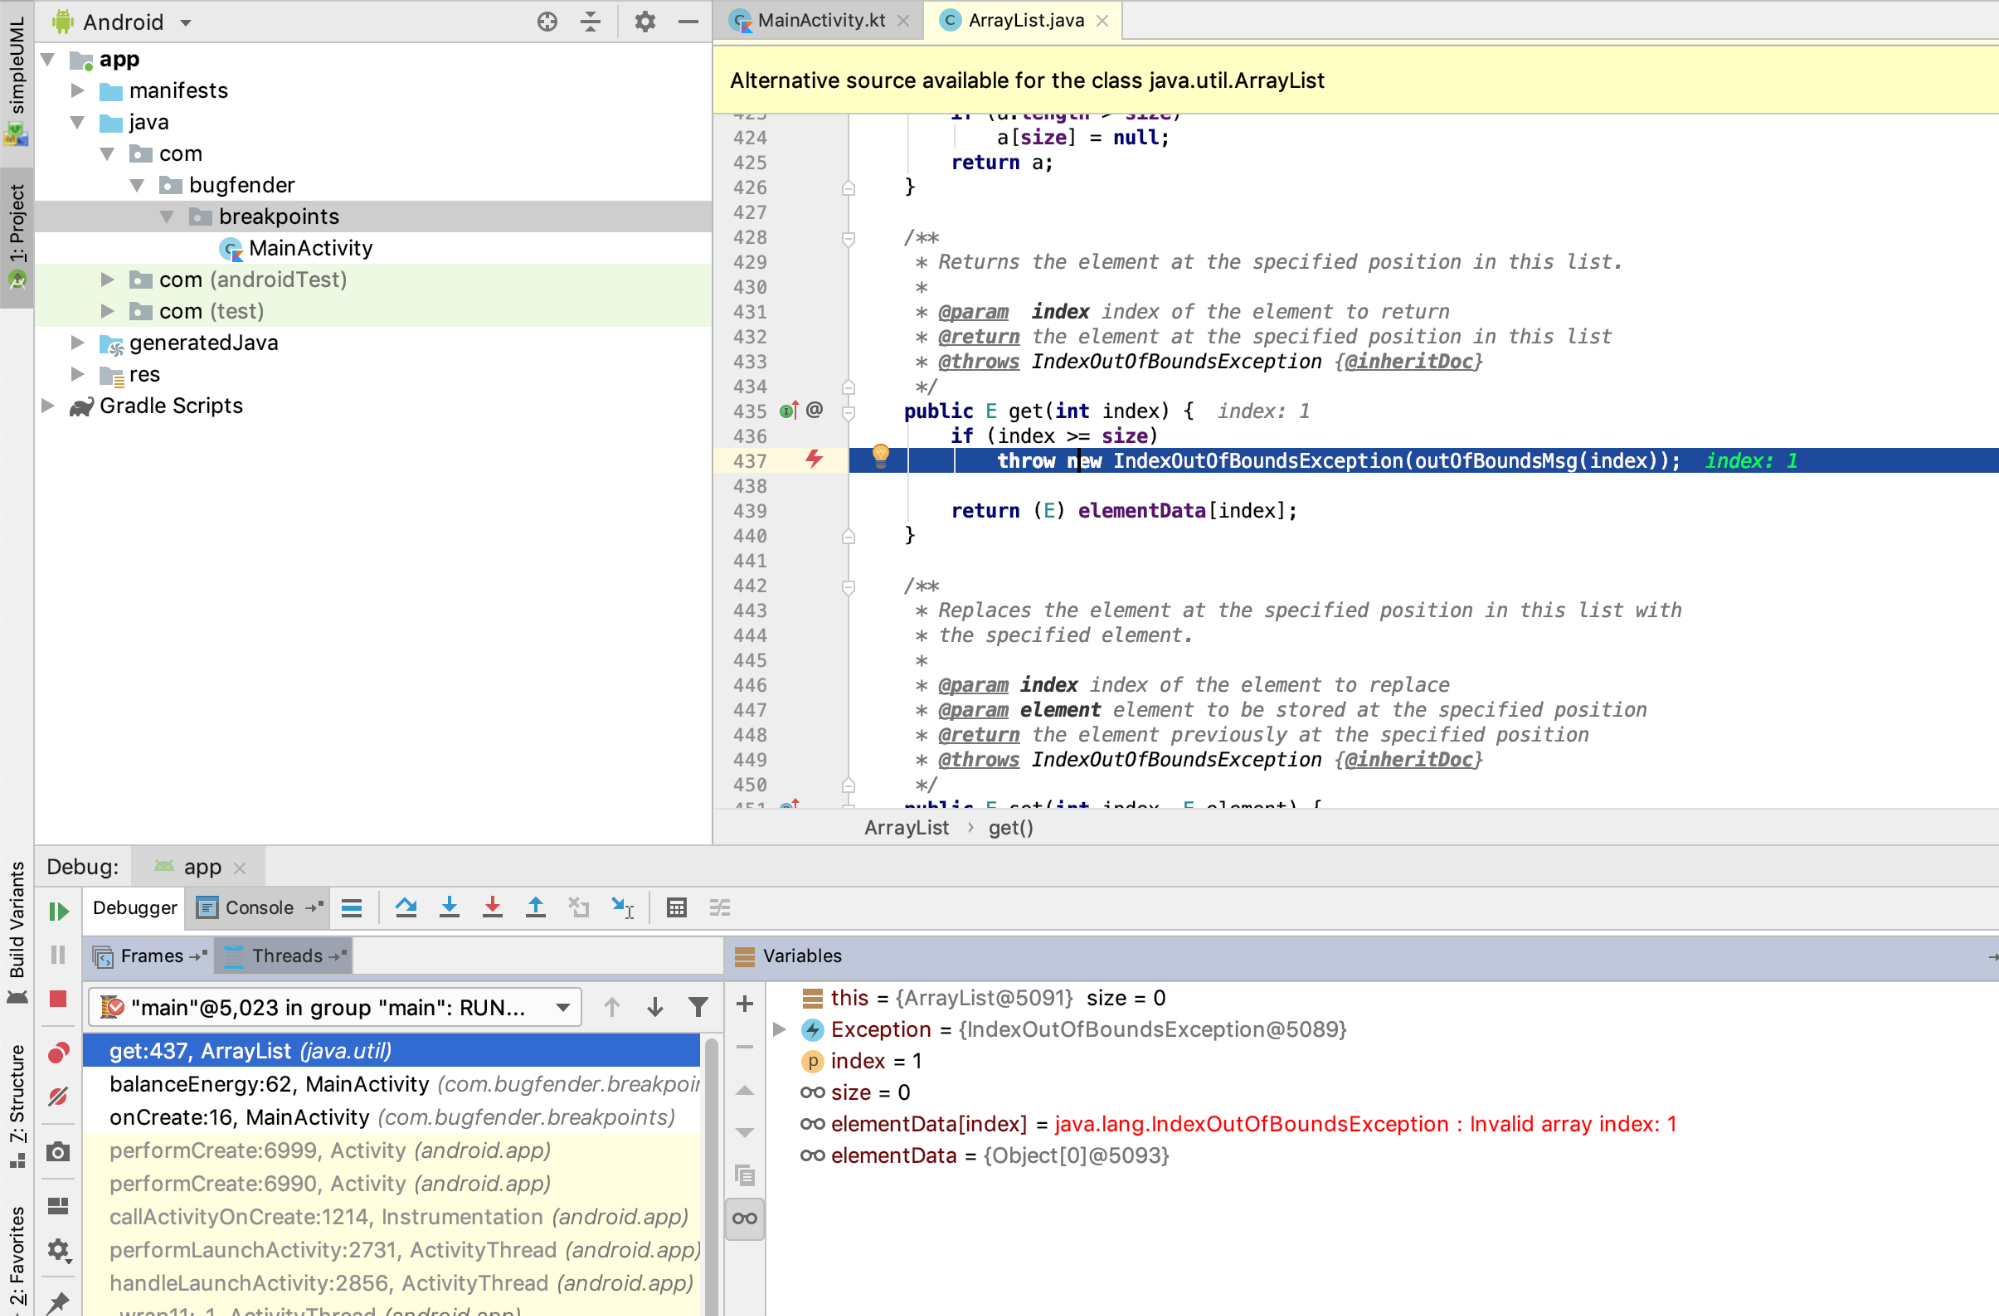
One thing that I find very useful in Android Studio are the Class Filters. Thanks to them, you can define relevant packages in which your Exception Breakpoint should be triggered and other classes that should be ignored.
In order to set filters you need to head to the Breakpoints window, enable Class filters and press the ‘close folder’ icon. You can explicitly add classes to your filters and exclude irrelevant ones (notice that wildcards are allowed).

Symbolic Breakpoints
Symbolic breakpoints are another type of conditional breakpoint, where the condition is “when function X is accessed”.
Sometimes you will be trying to debug third-party frameworks and you don’t have access to the code. It might be a framework like Bugfender (highly unlikely because Bugfender doesn’t have any bugs 😁) or it might be an iOS framework.
For these cases you can use a Symbolic Breakpoint. Similar to Exception Breakpoints, you can set a breakpoint based on a symbol (a method or function name). You don’t even need to know where this method is.
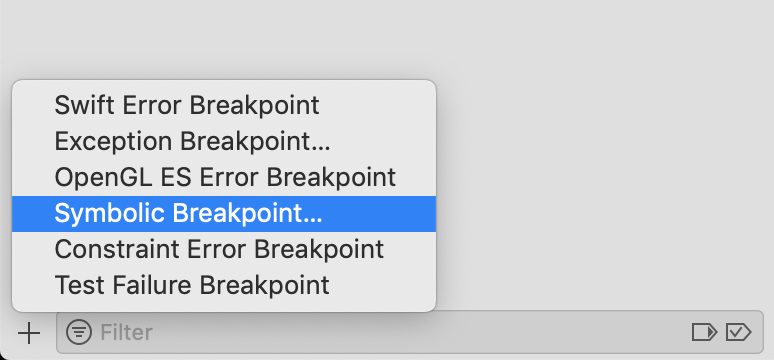
In Xcode, go to the Breakpoints pane and add a new Symbolic Breakpoint
Now, write the name of a method you know. For example viewDidLoad:
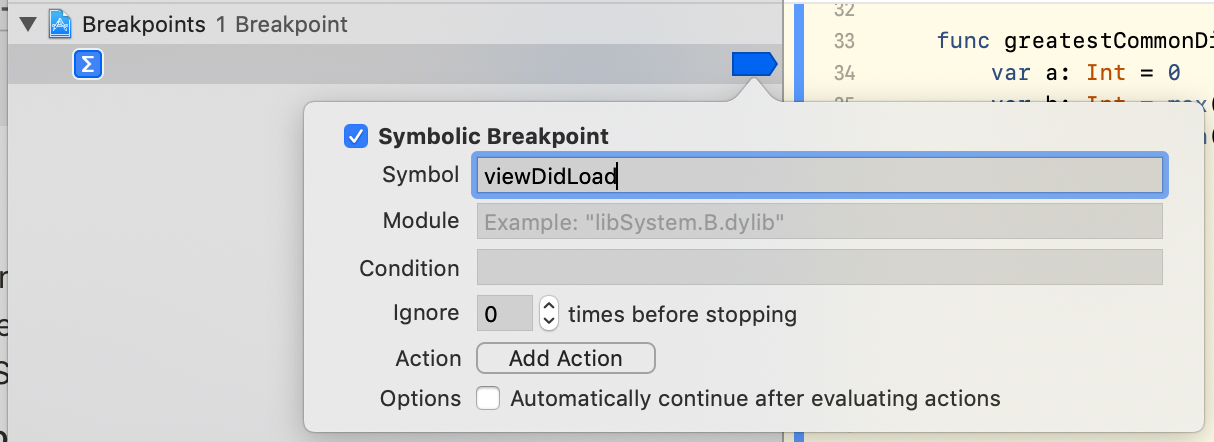
Press Run and you will see the magic happening. Xcode will find all the incidences of the symbol in your project, not just in the code but also in the iOS internal classes.
All these breakpoints will be triggered when their methods are called, allowing you to follow the execution of your app.
[sign-up-banner]
Until Next Time…
Right, that’s all for today folks. Hopefully you will be able to use all this information to save some time during your debugging sessions. If that’s the case, let us know as we are always happy to get feedback from developers.
Breakpoints are a great tool for debugging while your devices are connected to your computer, but what happens once you ship a beta version to your users? How can you continue debugging your app now that you will not have access to breakpoints?
In that case it’s time to talk about logging. We’ll be covering that topic in the next chapter of the Debugging from Zero series. If you do not have one, create a Bugfender account right away and start gathering logs, they’ll be useful!
Thanks for reading!
Expect The Unexpected!
Debug Faster With Bugfender


