8 Minutes
How to Read and Analyze iOS Crash Reports: A Developer’s Guide
Fix Bugs Faster! Log Collection Made Easy
The crash-proof app doesn’t exist. It never has, and it probably never will. Because apps can crash for all kinds of reasons, some of them impossible to foresee. No matter how well we build them, crashes are going to happen to our apps.
So, as devs, we need to know how to react to a crash when it happens. And in this context, understanding crash reports is crucial. They provide the clues we need to put the pieces together.
In this article, we’re going to look specifically at understanding iOS crash reports, so you can find the root cause and track it, and ultimately fix problems faster.
Table of Contents
A quick summary of what you’ll learn today
- What crashes actually are, with examples.
- How to use crash reporting and the crash log to figure out the root cause.
- How stack traces and other crash data can make our lives (waaaayyyy) easier.
- How to avoid crashes through proactive use of crash reporting and logging tools.
- How you can find the right iOS crash reporting tool for you, and go beyond the simple crash report to achieve proactive defense.
Before we go on, a quick note to say that yes, we offer a crash reporting tool at Bugfender. But we’ll try to be as objective as we can.
Ok so first, what are crashes?
An app crash is any force termination of our app that happens due to an unhandled exception. Those exceptions can take many forms. Here are just a few:
Index out of range
This is a particularly common exception type, and occurs when we try to access an index, on any collection, that does not exist. You can easily reproduce an index out of range instance, with the following code:
let array = ["1"]
print(array[2])
Force unwrapping
Any time we force unwrap, there is the possibility of creating an app crash. That’s why, in general, it is advisable to use safer coding practices. As an example:
var optionalValue: String? = nil
print(optionalValue!)
Dividing by zero
Another common termination reason is the failure to put any checks into our code, and when we come to a division and the divisor is 0:
func divideTenBy(divisor: Int) -> Int {
	return 10 / divisor;
}
...

divideTenBy(0)
Invalid casting of types
When we force out a cast to an unrelated type, we also get a crash:
    let a = 10

    print(a as! String)
We could go on here, because, as you’ll know, there are lots of ways to crash an app, and even if we avoid any of these mistakes, our users can trigger a crash by exposing unexpected edge cases.
So now, let’s look at what action we can take, starting with the stack trace, the most important analytics data at your disposal.
Reading a stack trace
A stack trace is the most crucial crash report we can obtain, because it tells us exactly what was happening when the crash unfolded.
Specifically, it shows us the method calls that our iOS app was processing when everything went wrong. With stack traces, we can see who was calling who at the moment of the crash, and pinpoint where the execution stopped.
For example, if you run the previously given example of the invalid casting type and run an app with it, you will get something akin to:
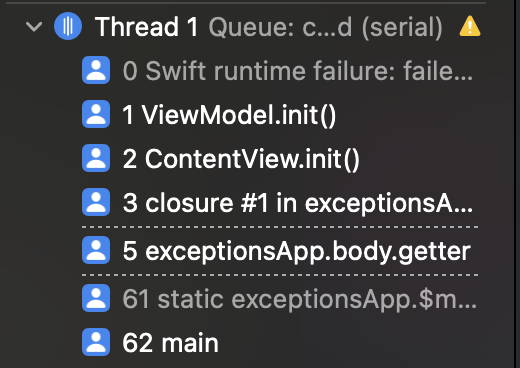
The ViewModel.init shows exactly where we had our crash. By looking specifically at this, we can determine what was causing the unhandled exception.
Additional tip: while running your iOS app, you can check, or log, your stack trace at any time simply by using:
for symbol: String in Thread.callStackSymbols {
    print(symbol)
}
Finding device crash logs
Now let’s take things a stage further. If you have physical access to an iOS device that has crashed, you can access the logs on the device directly to get priceless debug information.
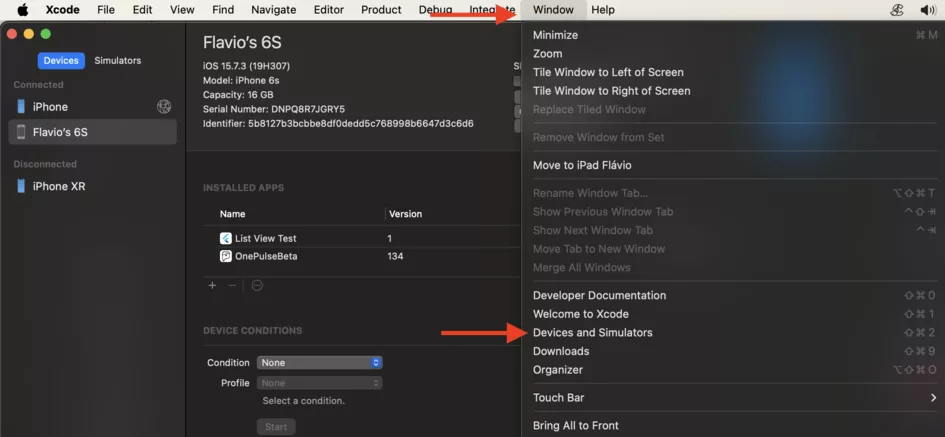
To do this, open up Xcode, then, on the Window Menu, open Devices and Simulators:
Here, we can choose a device and look at the device’s logs:
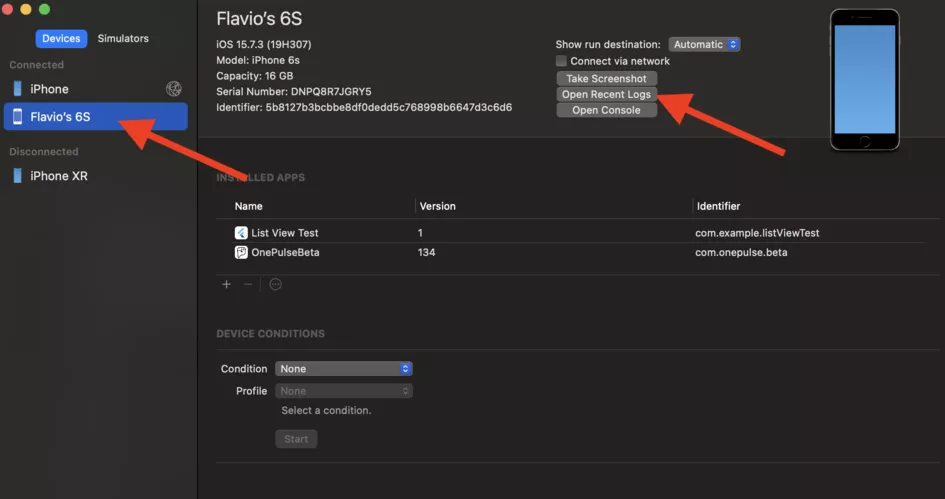
Now we’ve got access to the stack trace, just like we saw earlier.
Symbolication
Symbolication is the translation of a crash’s information from memory addresses into a more humanly readable format. As an example how would you prefer to look at a crash report, A, or B?
A.
Thread 0 Crashed:
0   App     0x0000000103478abc 0x103470000 + 35516
1   App     0x0000000103478f32 0x103470000 + 36658
B.
Thread 0 Crashed:
0   App     0x0000000103478abc -[ViewController viewDidLoad] + 40
1   App     0x0000000103478f32 myScreen + 22
It is obviously B, since we can tell where things went wrong in that, while A is just an unreadable stack.
How does it work?
For us to be able to symbolicate crashes, we need dSYM (Debug Symbol) files that are generated in each build of our app. You can download these dSYM files from App Store Connect by going:
Your App > TestFlight tab > Choose the build you’d like to have dSYMs for > Build Metadata tab > Download dSYMs button
Once you have your dSYM, you are able to symbolicate it to be more readable.
Symbolicating a dSYM
Xcode is the preferred way to symbolicate crash reports because it uses all available dSYM files on your Mac at once.
To symbolicate in Xcode, click the Device Logs button in the Devices and Simulators Window, that you can access from the Windows menu button on top, then you just need drag and drop the crash report file into the list of device logs.
Avoiding crashes
Now as we said at the top, there will always be an issue somewhere in your apps, and it’s nigh-on impossible to make them bug-free. However, there is a way we can avoid many common issues, and it’s known as defensive coding.
We will now go back through all the crashes we showed earlier, and using simple safe coding practices, we will make changes to fix the issues shown:
Index out of range
Checking the index beforehand is the best way to avoid an inexistent index. In our case, if we wanted to still be able to access the index 2, here’s how we’d do it:
let array = ["1"]

if(array.count >= 3) {
   print(array[2])
} else {
...
}
Force unwrapping
There are many ways to avoid force-unwrapping, from guards to if lets, to default values:
var optionalValue: String? = nil

guard let value = optionalValue else { return }

print(value)

---//---

if let value = optionalValue {
	print(value)
}

---//---

print(optionalValue ?? "")
Dividing by zero
One of the approaches we can take is to check whether the divisor is 0. If it is, just return 0.
func divideTenBy(divisor: Int) -> Int {

	return divisor > 0 ? (10 / divisor) : 0;
}
...

divideTenBy(0)
Invalid Casting of types
We should always check for the type with is:
    let a = 10
    if(a is String) {
	    print(a as! String)
    }
Crash and error reporting tools
Ok, so we´ve got a basic grasp of how to catch errors in our apps. But the best way to understand the issues that our apps face in our users’ devices is to have a platform that provides total visibility over all issues that show up.
As we write this piece in 2025, there are two primary crash reporting tools that provide this kind of service, and one is Bugfender. Below, we’ll give you a quick (and we hope, fair) overview of each:
Bugfender
One of the key USPs of Bugfender is that it supports both crashes and general device logs. In other words, the program logs everything, even when the app is running fine. As well as being a great crash analytics tool, it allows you to carry out proactive, round-the-clock performance monitoring of your app quality and app performance.
You can configure the priority of all different kinds of performance issues, and also configure how you get alerts of said issues. With the logs displayed alongside the crashes, you get a truly complete crash report, so you can truly understand what was happening on the device at the time of the crash.
If you’d like to incorporate Bugfender into your app, we’ve recently made an article on how you can do so using SwiftUI and also integrate Alamofire. you can read the piece here.
Firebase Crashlytics
Firebase Crashlytics is a pure crash reporter, and it has lots of real plus-points, notably the fact that it automatically collects crash information alongside application specific information about the device.
The main downside when comparing to Bugfender is that Crashlytics will not capture logs by default, nor does it automatically support non-crashing issues. You can manually log any errors that don’t lead to crashes, and it’s really simple, but you can’t add logs to Crashlytics.
So if you’re purely interested in the crash details, this is a great option. If you want a more proactive product, we’d recommend ours,but in reality, both will give you a valuable crash report.
Summing up
it is near impossible to have an app without crash occurrences, especially in the early stages of the build. However there are ways to avoid crashes, using defensive coding, and also ways to figure out where the issues lie.
What’s more, there are platforms we can use to help us track those issues and have an overview of how often/when they occur to help us mitigate them and fix them as fast as possible.
Hopefully this article has helped you in any way understanding iOS crashes. If you want any more info on how to analyze a crash report, and compare the different crash report tools on the market, we’d be happy to help.
Happy coding!
Expect The Unexpected!
Debug Faster With Bugfender