
19 Minutes
Optimize your iOS app perfomance using MetricKit
Fix Bugs Faster! Log Collection Made Easy
For iPhone and iPad app development, one of the main aspects is the app’s performance.
Performance is about your application not crashing, but also how quickly and smoothly it can carry out its functions when users interact with it. An application whose functions consume a lot of battery life, or an application that doesn’t like to wait too long until it finishes whatever it wants to do, can lead to users uninstalling the app.
That is why it is very important to check the performance of the app. A tool that can help with these checks is called MetricKit. Apple introduced MetricKit with iOS 13 in 2019 to help developers better understand the performance of their apps – and what’s cool is how MetricKit automatically collects performance metrics for your app, so you will be able to achieve a better performance and improve the user satisfaction.
That way, whatever you do with your app, you’ll receive actual data created from real-life usage. This helps provide an understanding of how your app is performing in test labs conditions, of course, but also how it’s performing when deployed to users and accessed in everyday scenarios.
MetricKit is very useful for developers because it provides an overview of every aspect of an application’s performance. This includes the battery consumption for your app, as well as the memory consumption, how long the app takes to launch, and many other things that could provide useful, detailed data for later.
That fine detail will help you improve your app further, boosting its efficiency – and, most importantly, providing a better user experience.
Table of Contents
Understanding of MetricKit
Apple introduced MetricKit framework with iOS 13 to provide the developers with a diagnostic tool to improve the performance and health of their apps. It gives the metrics of how an application behaves on user devices, while also providing insights that are beyond the traditional method of debugging and testing.
These are the capabilities and features of MetricKit:
i) It will automatically collect daily iOS performance metrics.
ii) Metrics include details about battery usage, CPU stats, disk usage patterns, memory usage and network perfomance.
iii) Creates detailed reports of app crashes and hangs that occur during usage, thus making it necessary for maintaining app stability.
iv) Provide the energy impact of an app, complete with data to help optimize battery usage.
v) Presets the data in histograms and percentile, with details of how an app performs in various usage conditions. MetricKit frameworks can be easily integrated with the iOS application.
MetricKit works closely with the Apple developer tools Xcode and Instruments, helping to give a clear understanding and detailed view of your app and its performance.
MetricKit is designed to follow Apple policy, so it collects data anonymously and with the users’ consent. It provides insight to developers, but never analyzes personal information. Integrating MetricKit with your app is very easy and it needs very little code changes to start collecting data.
Getting Started with MetricKit
Starting with iOS 13, MetricKit is available to you as a Developer. Make sure the device you are using, or the device you plan to use for testing, is compatible with iOS 13 or later, whether you are using an iPhone or iPad. The latter needs to be running iPadOS 13 or later.
There are no special hardware requirements for your device to use MetricKit. To incorporate metrics in your mobile app, you need to enable MetricKit and set it up accordingly in your Xcode project.
MetricKit Flow Diagram:

Follow these steps to integrate MetricKit in your project:
Add the following MetricKit in your project:
- First, open up your Xcode project.
- Go to the project settings, select your app target, and go to the ‘General‘ tab.
- In the ‘Frameworks, Libraries, and Embedded Content‘ section, click the ‘+‘ and add MetricKit.

Import MetricKit in your code: if you want to use MetricKit framework, you’ll need to import the file where the function is supposed to use this functionality. Add import MetricKit.
import MetricKit
Register the Metrics Delivery: to implement the MXMetricManagerSubscriber protocol in a suitable class AppDelegate. MXMetricManager.shared singleton to subscribe for metrics delivery with MXMetricManager.shared.add(self).
//Add MXMetric manager's singleton object.
MXMetricManager.shared.add(self)
Handling Metrics Reports: Implement the methods to handle all incoming metric payloads. Like didReceive(_ payloads: [MXMetricPayload]) of MXMetricManagerSubscriber.
func didReceive(_ payloads: [MXMetricPayload]) {
    for payload in payloads {
        // Process the payload
        print("Received the metric payload: \(payload)")
    }
}
Integration class diagram:
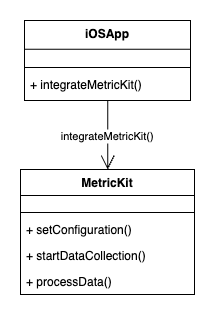
All these pieces interplay with the data given by MetricKit to help the app developer understand how their app is performing during real-world use. Lastly, the installation process will guide developers through how to practically use this API in the application and how to optimize the iOS app. Central to the functionality of the application, these components of MetricKit API are listed below:
i) MXMetricManager. It is a core class, used to manage the subscription to metric reports. Consequently, it will be used to add or remove subscribers and set the delivery schedule for metrics and, most crucially, to manage how and when subscribers will get metrics. Additionally,
ii) , an MXMetricPayload represents all the performance metric data collected in a 24-hour period.
iii) MXAppRunTimeMetric: contains metrics related to the app state or app during the foreground and background state. These terms or classes will manage different types of details for precise system resource items to be an MXCPUMetric, MXMemoryMetric, MXDiskIOMetric, MXNetworkTransferMetric, etc.
Finally, MXCrashDiagnostic, MXHangDiagnostic, and MXErrorDiagnostic are the classes that provide details or more diagnostics for crashing, hanging, and errors such as JSON bugs.
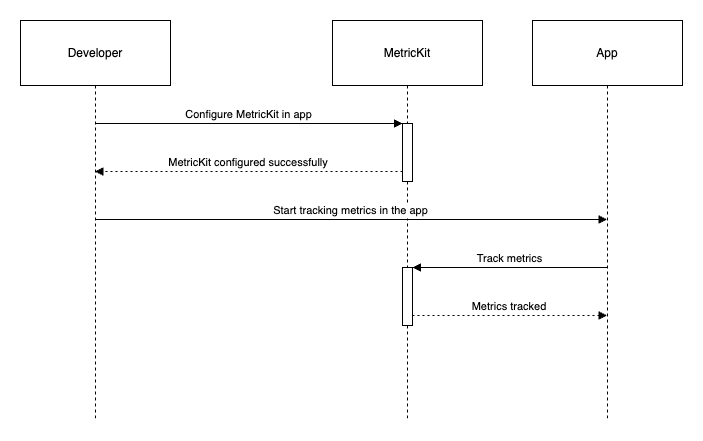
MetricKit Sequence Diagram:
Core Metrics Available in MetricKit
Overall, MetricKit is an entire area of all possible metrics that are necessary for conducting a comprehensive audit of the performance and health of iOS applications. As you can imagine, the information you receive from it is valuable and necessary for further work. This information can be used to optimize and improve your application.
Performance Metrics You Can Collect with MetricKit:
- CPU usage. This metric measures how much CPU time your application uses. It means the developers can easily determine which computations are too big and need to be optimized.
- Memory usage. This section measures the application’s average and peak memory consumption. More importantly, it allows you to determine if there is a memory leak or if the app is causing excess consumption.
- Energy usage. Determine how your application consumes energy and how efficiently the device’s energy is spent.
- Disk I/O. This measure collects data and statistics of read and write operations with files and the database.
- Network transfer. This section measures how much data is sent and received on the network.
- Graphics performance. Collects measurements of rendering and frame rate.
- User Interaction Metrics like app launch time and app responsiveness**.**
Let’s have a Detailed Look at Performance Metrics:
- CPU Usage: High CPU usage often leads to excess battery drain and your device heating up. The MetricKit reports can help point out which functions or processes are taking too much time or consuming too much energy.
- Memory Usage: Keeping an eye on memory usage helps identify memory leaks and highlight places where you could free up memory storage for more efficient performance.
- Energy Usage: This metric will help you determine the battery usage pattern of your apps and whether there are any anomalies, such as energy and power consumption spikes. It also helps show spikes that indicate when certain functions of the app are being used.
- Disk I/O: Optimizing the app’s disk routine ensures app performance is not reduced by disk read/write operations when using data-consuming apps.
- Networking Transfer: This helps developers tinker with data payloads to make data transmission to and from servers more efficient, thus reducing cost and improving responsiveness.
How MetricKit Gathers and Reports the Diagnostic Data:
MetricKit gathers the diagnostic data using a system-wide approach that is friendly to the privacy of the user. Here’s how:
- Data collection: MetricKit collects this data passively, i.e., in the background, so it does not interrupt the app’s normal operation. The collection is done by the system automatically, so there is uniformity.
- Data Reporting: The collected metric data is delivered to the subscribed app every 24 hours, and is then accessible by the developers through the MetricKit API.
- Reports: These diagnostic reports include detailed accounts of crashes, hangs, and errors occurred during app usage. The data compiled by these reports can help an app developer discover the cause of an issue.
Code Examples:
MXMetricPayload response handling:
func didReceive(_ payloads: [MXMetricPayload]) {
    for payload in payloads {
        // CPU Metrics data
        if let cpuMetrics = payload.cpuMetrics {
            print("CPU time: \(cpuMetrics.cumulativeCPUTime)")
        }

        // Memory Metrics data
        if let memoryMetrics = payload.memoryMetrics {
            print("Peak memory usage: \(memoryMetrics.peakMemoryUsage)")
            print("Avg memory usage: \(memoryMetrics.averageMemoryUsage)")
        }

        // Disk I/O Metrics data
        if let diskMetrics = payload.diskIOMetrics {
            print("logical writes: \(diskMetrics.cumulativeLogicalWrites)")
        }

        // Network Transfer Metrics data
        if let networkMetrics = payload.networkTransferMetrics {
            print("Cumulative cellular data received: \(networkMetrics.cumulativeCellularDownload)")
            print("Cumulative Wi-Fi data sent: \(networkMetrics.cumulativeWifiUpload)")
        }

        // Energy Metrics data
        if let energyMetrics = payload.energyMetrics {
            print("foreground energy consumption: \(energyMetrics.cumulativeForegroundEnergy)")
            print("background energy consumption: \(energyMetrics.cumulativeBackgroundEnergy)")
        }

        // App Launch Metrics data
        if let launchMetrics = payload.applicationLaunchMetrics {
            print("launch time: \(launchMetrics.histogrammedTimeToFirstDraw.median)")
        }
    }
}
MXDiagnosticPayload response example:
func didReceive(_ payloads: [MXDiagnosticPayload]) {
    for payload in payloads {
        // Crash Diagnostics data
        if let crashDiagnostics = payload.crashDiagnostics {
            for crash in crashDiagnostics {
                print("Reason: of crash \(crash.terminationReason)")
                print("Crash occurred: \(crash.virtualMemorySize)")
            }
        }

        // Hang Diagnostics data
        if let hangDiagnostics = payload.hangDiagnostics {
            for hang in hangDiagnostics {
                print("Hang duration: \(hang.hangDuration)")
            }
        }

        // Application Exit Diagnostics data
        if let exitDiagnostics = payload.applicationExitDiagnostics {
            for exit in exitDiagnostics {
                print("Exit reason: \(exit.exitReason)")
                print("Exit description: \(exit.terminationReason)")
            }
        }
    }
}
Handling and Interpreting the Data Collected by MetricKit
Each payload contains highly detailed metrics regarding performance, like CPU usage, memory usage, energy impact, etc. Each of those metrics is accessed as varied properties on the payload object, such as cpuMetrics , memoryMetrics , and so on. It’s then possible to analyze these metrics to infer patterns of usage and key inferences, which may be drawn to enhance behavior and usage, such as lower energy use and reduced memory leak.
Visual representation of the data is possible with the use of tools, showing trends and deltas in these metrics as time progresses. It uses a dashboard and charting tools to examine the data in a way that is more visually apparent and effective.
It’s then possible to export the captured data and use this knowledge with additional tools. Integrated Tableau, Looker, Excel, and other analytics tools can be used to drill down into metrics and compare metrics through state, or across multiple versions.
Best Practices for Collecting Data Efficiently
Here is the summary of Efficient Data Collection Recommendations:
Regular Monitoring
Monitor these metrics on a regular basis. Use alerts or automated reports to get notifications of these metrics, either generally or whenever they cross a crucial threshold. This gives you the necessary time to inspect these metrics and give early attention to any concerns in your app’s performance.
Privacy
Although MetricKit abides with privacy rules, ensure that you follow them too while interacting with Measurement Data.
Selective Collection
Collect only metrics that are related to problems you are trying to solve. Do not gather a ton of extra data and hope you will know where to start. Having a lot of data will require a lot of cleaning before understanding, which can lead to missing some vital details.
Documentation
Document the metrics trends and interpretations of these measurements. Understand why some metrics are low or high, and know which metrics are expected to change and when. This will help you know what you saw when making changes, and even understand which part of your changes is causing what you see. Recorded information will be of great use in future versions of the app.
Using these rules and MetricKit will greatly help you improve your iOS apps’ performance and experience. Regular monitoring will give you a guide on what to edit to keep enhancing your app.
Using MetricKit Data in the Real-World
Memory leak: During app testing, it was discovered that the memory usage of the app kept increasing and never reduced. This problem was fixed by investigating memoryMetrics from MetricKit, which showed the memory allocated would never be marked as free, even when it is queried. The bug was fixed, and the app’s memory usage normalized.
Battery drain: during A/B testing, end-users reported that opening the app on their phones drastically reduced their battery life application at runtime. Through its dataset, a food delivery app realized that it forced the device to keep waking up every few seconds to check the network and sleep, and it was fixed. As a comparative analysis showed, the app had the network refreshed every few seconds; he metric showed the calls could be made and refueled for a day, reducing the uptime refreshment frequency equivalent to reducing battery drain by 87.5%.
Launch speed: During testing, it was reported that applicationLaunchMetrics displayed the food delivery app is taking too long to launch. After investigating the launchMetrics, some CPU and IO bound tasks were discovered on the main thread. The app was fixed by making critical tasks run on the background thread.
Integrating MetricKit with Development Workflows
By integrating MetricKit into the daily practices of development, it is possible to achieve substantial improvement to the productivity and efficiency of iOS apps. Here are some pieces of advice on how to connect the data of MetricKit, automatize the monitoring of the performance, and use it together with additional profiling instruments included in Xcode.
Strategies for Integrating MetricKit Data into Daily Development Practices -Organizing frequent review meetings: Standard, well-scheduled meetups with your development team aimed to check the MetricKit’s reporting, discovering trends, a rise of common issues, or improvements in the fixes implementation.
Testing extension: Adding the MetricKit’s data analysis to the testing block might reduce the amount of performance related issues discovered by end-users. Pre-releasing a critical patch or update, then check the received MetricKit reports to avoid the appearance of new issues.
Performance baseline: Having the baseline to compare can help you quickly determine what part of the app or device’s performance is affected by new updates.
Automating Performance Monitoring with MetricKit
Establish a protocol that generates an alert based on the MetricKit data, incase a specific threshold is exceeded. One can implement a script that monitors the daily report and sends an alert if the daily memory usage exceeds a specified allowance. It is a scripted check, so that if the average standby memory is more than a predefined amount, an alert will occur. This protocol enables monitoring to be one-way and removes the daily need for manual review.
//Function to recieve memory usage alerts
func didReceive(_ payloads: [MXMetricPayload]) {
    for payload in payloads {
        if payload.memoryMetrics.averageSuspendedMemory > expectedMemoryUsageLimit {
            sendAlert("M/M usage alerts: \(payload.memoryMetrics.averageSuspendedMemory)")
        }
    }
}
Case Studies
MetricKit gives invaluable information that can positively impact the performance optimization of an iOS application. The following are real examples of the application of MetricKit that helped identify and eliminate performance issues, which later improved user experience and efficiency of the applications:
An application which often drained social support systems users’ batteries.
Problem: A typical social networking application had an issue, with many users complaining about the app draining their batteries.
Findings: Through the use of MetricKit, developers were able to collect and analyze battery consumption metrics. It was established that the app was continuously checking for updates, even when most users were not using the app, since they only used a video playback feature.
Solution: The developers redefined a background process. This dispatched efficient polling that acquired data when necessary, and stopped checking when not required, thus enabling the app to acquire saved energy and no longer update when not required.
Result: The information was already available in the trend data. According to MetricKit, the developer observed a 30% decrease in the energy consumption trend, and battery depletion cases quickly ceased to be a problem.
Here is an example of feature launch time decrease in e-commerce application.
The problem was with an e-commerce application that showed a slow launch time. The investigation revealed that, using app data provided by MetricKit, the app startup was using resources aggressively. High resolution images are downloaded in the memory that are needed to launch the application.
The solution proposed to the team was to load only the images that are used in the end from the server, and in the beginning load only low-resolution images on the feed. Due to the implementation and above change, the launch time was reduced by half. The result was that the MetricKit report confirmed suggested changes. It then behaved progressively for the next launch and no more negative feedback was given.
To Sum up:
In my opinion, the above examples of MetricKit metrics – such as CPU usage, memory usage, energy impact, disk I/O, network activity, and dozens of others – are important to understand the overall performance of your app.
In addition, when we have a daily report on your iOS app performance, it is possible to be constantly aware of, and correct, the issues before they become severe. The other lessons learned with MetricKit are irreplaceable. It helps developers to make adjustments and, as a result, the app consumes less battery and works more smoothly. I think these are the two most important reasons for users to be glad to use your app, as they do not care how much time you spend daily managing the app’s resources. Integration with the project was straightforward, and the daily reports helped me understand how the app works. The most critical task is to create high performance, fluent, and bug-free apps.
Use MetricKit, and you’ll be one significant step closer to being an iOS app optimization master. Apple released MetricKit framework with iOS 13, which provided a diagnostic tool to improve app performance and health. It shows the metrics of how an application behaves on the user’s devices and gives more insights than conventional frameworks can do by debugging and testing.
i) It will collect app performance metrics, daily and automatically, without any manual insights.
ii) Daily metrics will detail battery usage, CPU stats, disk usage patterns, memory usage stats, and network usage statistics.
iii) It also gives detailed reports of application crashes and hangs that have occurred while the app is being used.
iv) It will also give energy impact for apps. That data helps us optimize our battery usage.
v) It represents the data in histograms and percentile data that will tell how the application is working in different conditions of its work.
MetricKit framework can be easily added into any iOS application to monitor the mobile app performance. This works very closely with the Xcode and Instruments, so it will give a clear understanding and perspective view of your app. The integration is very easy, and it needs very little code to change to start collecting the data, so when you start any new iOS app development, plan ahead and get ready to monitor the application performance as it can make a big difference in the final app experience.
Expect The Unexpected!
Debug Faster With Bugfender

Sachin Siwal
Sachin is an accomplished iOS developer and seasoned technical manager, combining 12 years of mobile app expertise with a knack for leading and delivering innovative solutions. You can contact him on Linkedin