We’re going to investigate the basic strategies to debug an application created with Unity, from logs to breakpoints, during the development stage. Once an app is in production we can switch to using Bugfender, and we’ll explain this too.
To illustrate this tutorial we have created a custom app called The Bugfender Game, a variation of the popular Flappy Bird.
What is Unity and What Is It Used For?
Unity is a cross-platform game engine that gives users the ability to create games and experiences in 2D, 3D, VR and AR.
Due to its simplicity and its all-in-one development environment it has been the most popular game engine for several years. Almost every single indie game developer either started building games using Unity, or is still using it.
On one side, Unity has a very intuitive design that makes it easy to use. On the other side, the choice of C# as the main language keeps things easy for programmers, especially when compared to other game engines like Unreal that require a high level of C++ knowledge. All of these features make Unity a compelling choice for small teams as well as for people starting to make games.
Add to that a great community, a huge asset store, and tons of tutorials and online courses and it’s easy to see why Unity has become – and remains – the most widely used game engine on the market.
Do I need a Unity license to follow this tutorial?
Unity offers a Personal License free of charge for people with annual revenue of less than $100,000. We don’t expect that you can earn that amount of money with this tutorial (although we’d be delighted to be proven wrong!) so go ahead and download Unity from the official website if you haven’t done so yet.
How to get started with Unity development
Download Unity from the official webpage and follow the steps to install Unity Hub so you can manage both your projects and Unity versions.
Check out this repository using:
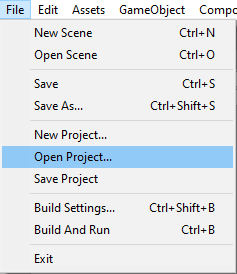
$git clone https://github.com/bugfender/unity-demo.gitOpen Unity and use the option Open Project to access the previously downloaded repo. We have used Unity 2019.4.0, but you can use any version older than 2018.
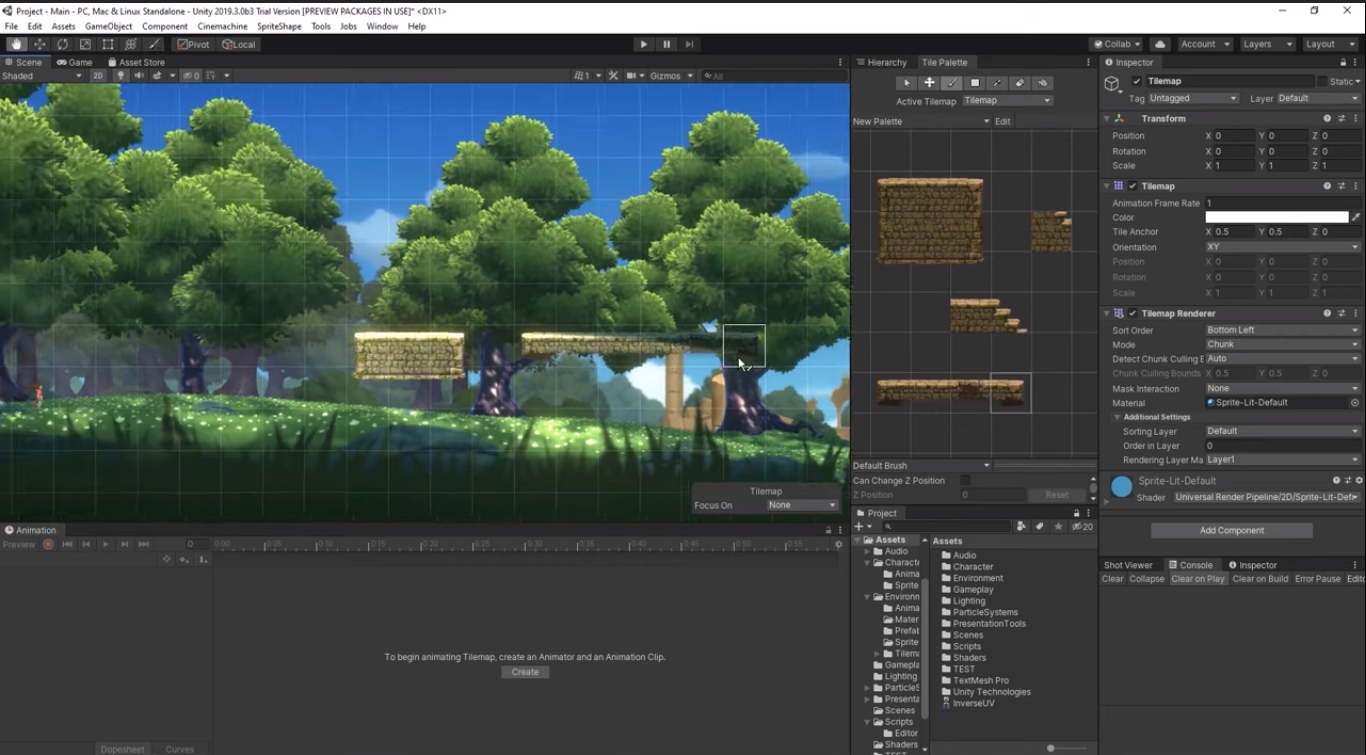
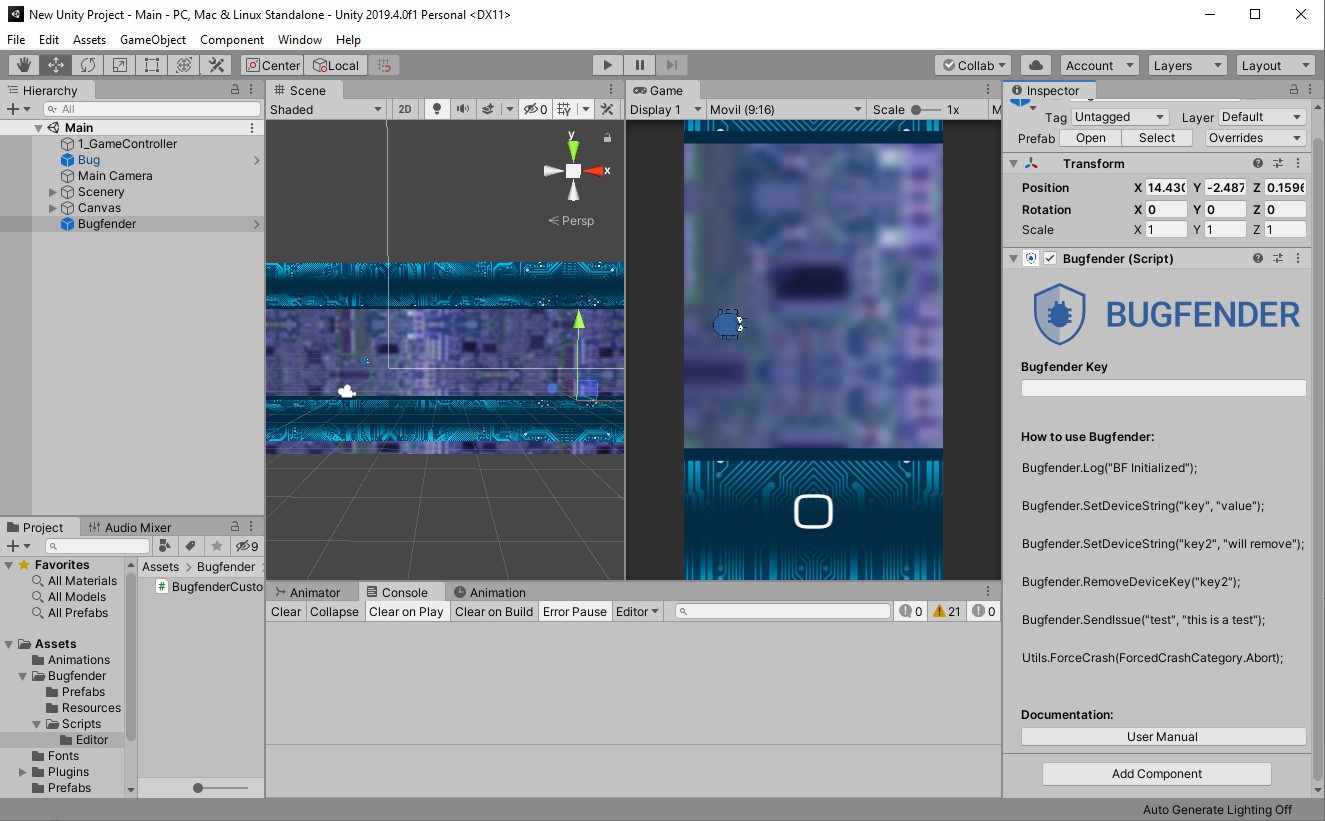
The project is what we have called The Bugfender Game. It is a clone of the popular Flappy Bird. You can press the play button and use the left click to move the main character.

In the lower left corner in the previous screenshot, you can see the Project panel where you can find the game classes. Double click in the GameController class and Unity will open Microsoft Visual Studio, which is the IDE we will use to write code and is installed by default on your computer, along with Unity.
How to debug a game in Unity
In Unity, like almost every other environment, we can use logs and breakpoints to debug our code.
How to use logs in Unity
To print a log in the console we can use Debug.Log in any part of our code.
Debug.Log("This is a log in Unity");Actually, we can differentiate between five different types of logs:
Debug.Log: the default log level. We can use this to register the execution of a concrete line of code or to log the value of a variable.Debug.LogFormat: similar to the previous log type, this one allows us to introduce formatted text.Debug.LogWarning: this is the warning log level. We can use it if – for example – our game reaches a certain point in the execution that was unexpected but not so worrying that we should call it an error. (Maybe some frames where dropped?)Debug.LogErrorandDebug.LogException: these are the error and exception log levels that we should use to register serious issues, like the main character of the game suddenly falling out of the scene.
In general, it is good practice using as much logs as possible, so when something unexpected happens we can go to the console and quickly revisit what exactly happened in the last few minutes.
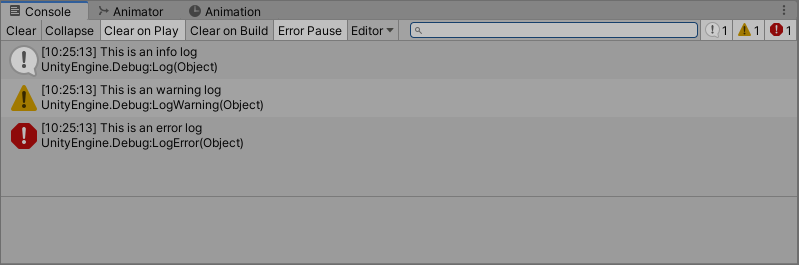
If you use the different log levels then, when you have several different logs, the Console Panel will display the logs with a different icon, which will help you understand the code execution. Moreover, you can use the buttons in the top right corner to filter the log levels that are important for you.
You can find more information about the Unity Logger via the official documents.
How to use breakpoints
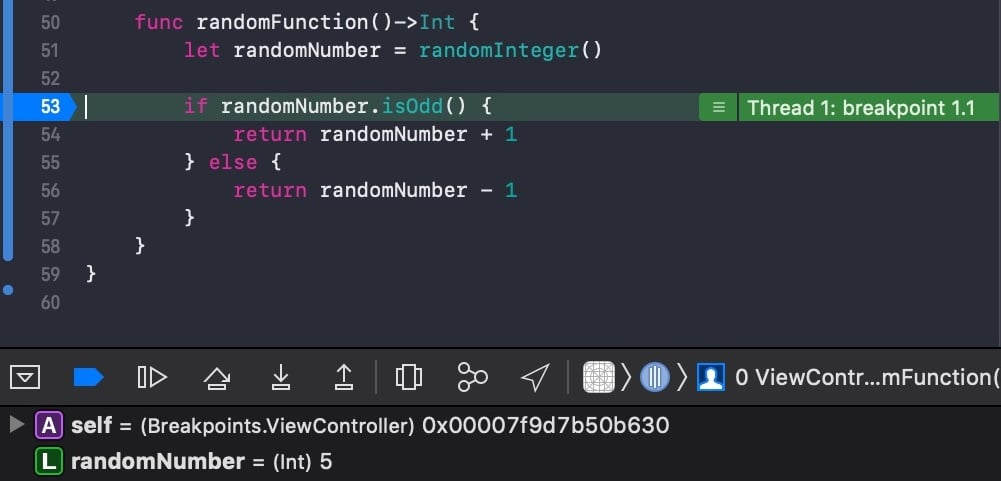
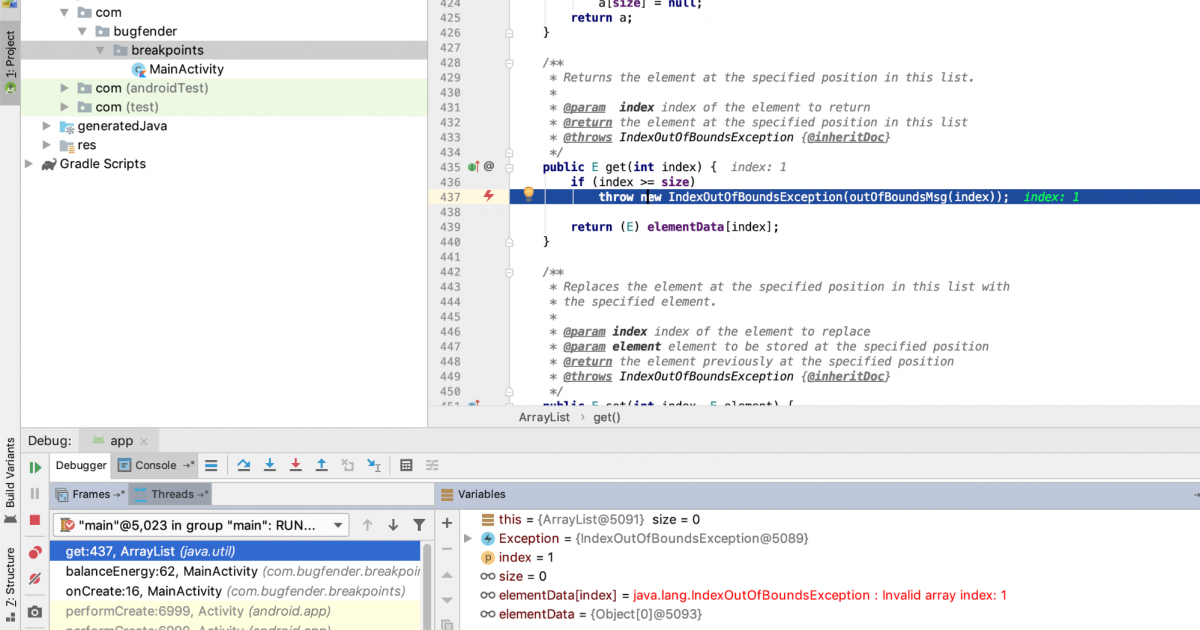
As you might know, a breakpoint is a mark in your code that will pause the execution of the game at the exact moment the code reaches the relevant point.
If you are not familiar with the use of breakpoints, we wrote two articles studying the concept in depth. Those articles were written for iOS and Android but the concepts are pretty much the same:
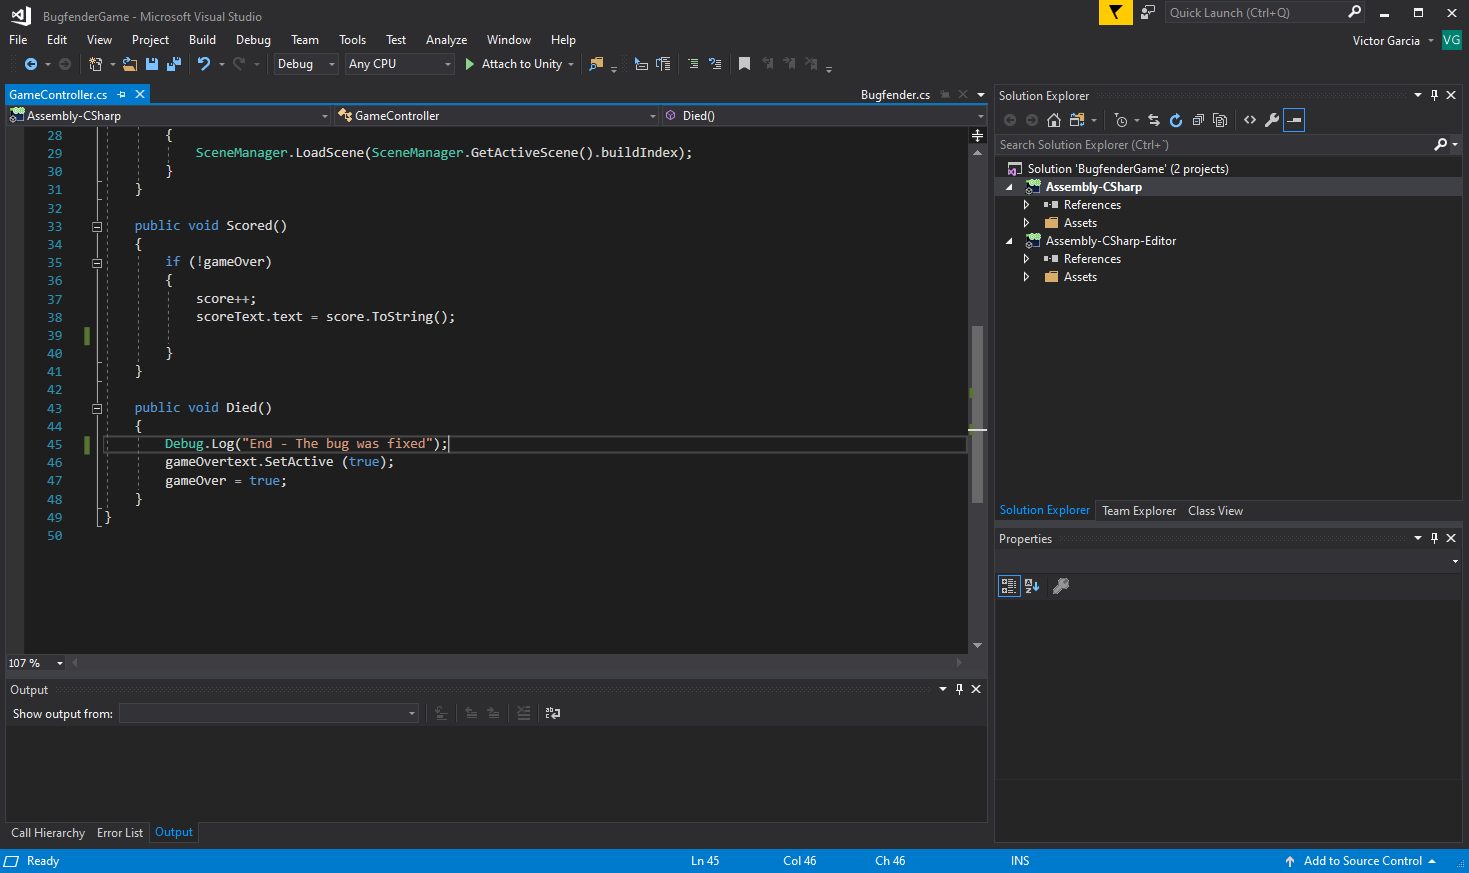
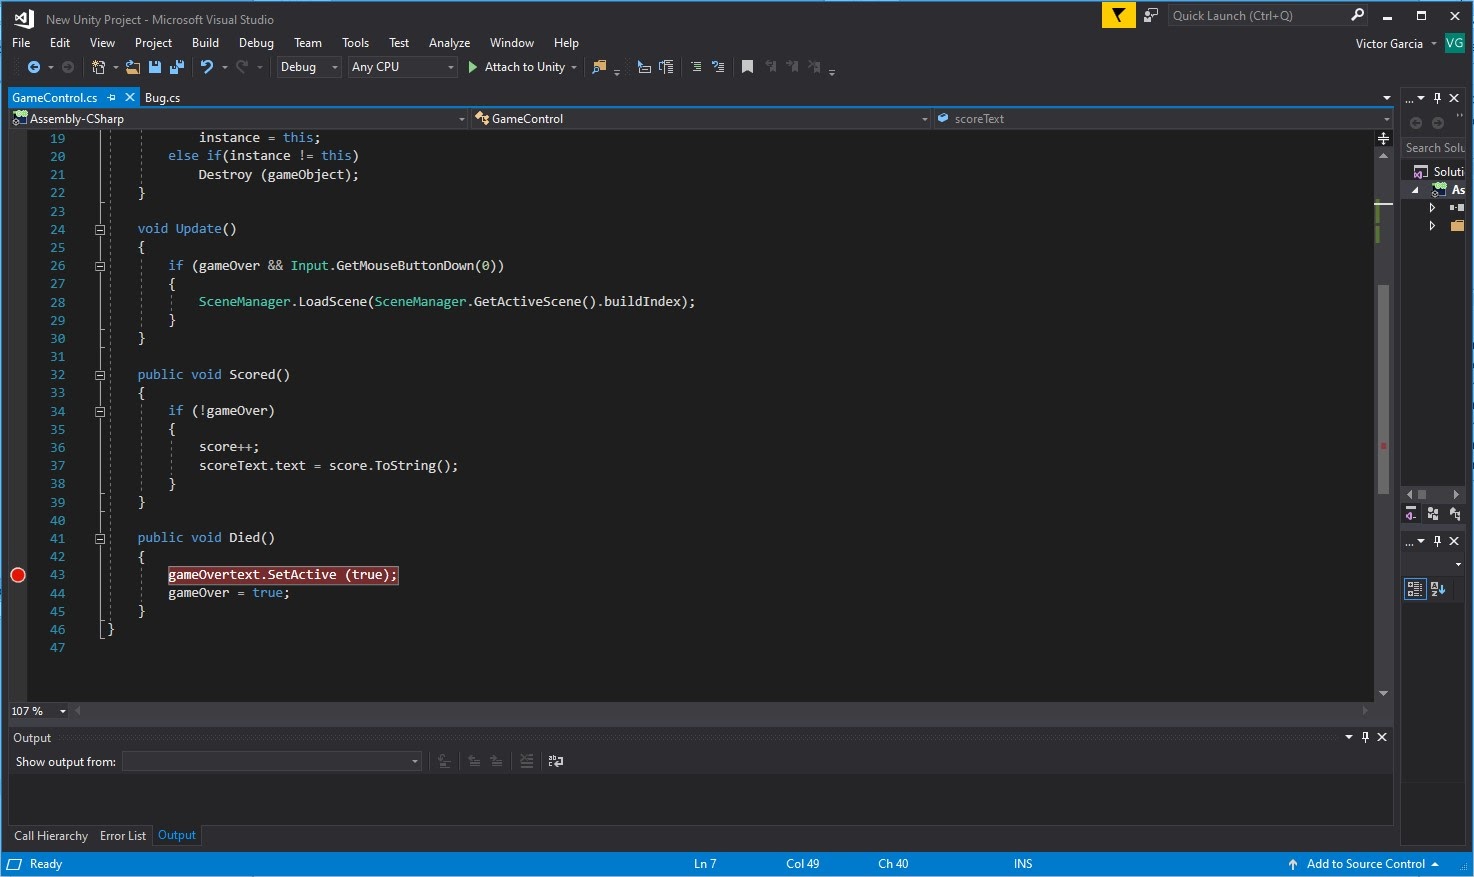
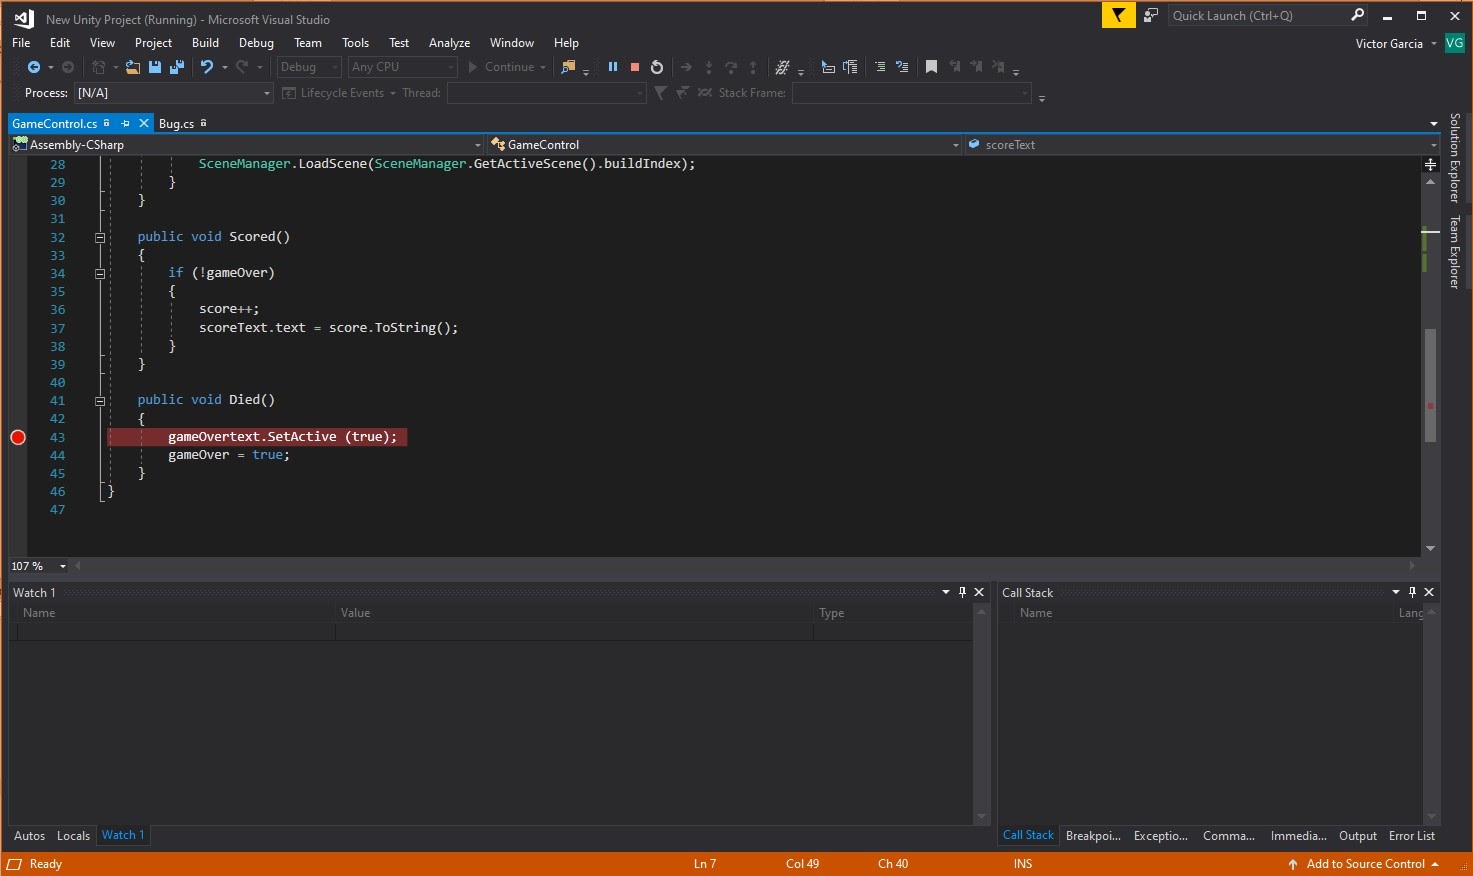
In Visual Studio, we can place a breakpoint in the left-hand bar of the window, close to the line number in which we want to interrupt the execution.
Once we set the breakpoint, we will need to click the button “Attach to Unity” on the toolbar, which enables the debugger.

Now, if everything worked, Visual Studio will switch to an orange outline meaning that we are in debugging mode.
Finally, we use our game until the execution of the program reaches the part of the code which contains the breakpoint. The execution will be immediately paused when this point is reached.
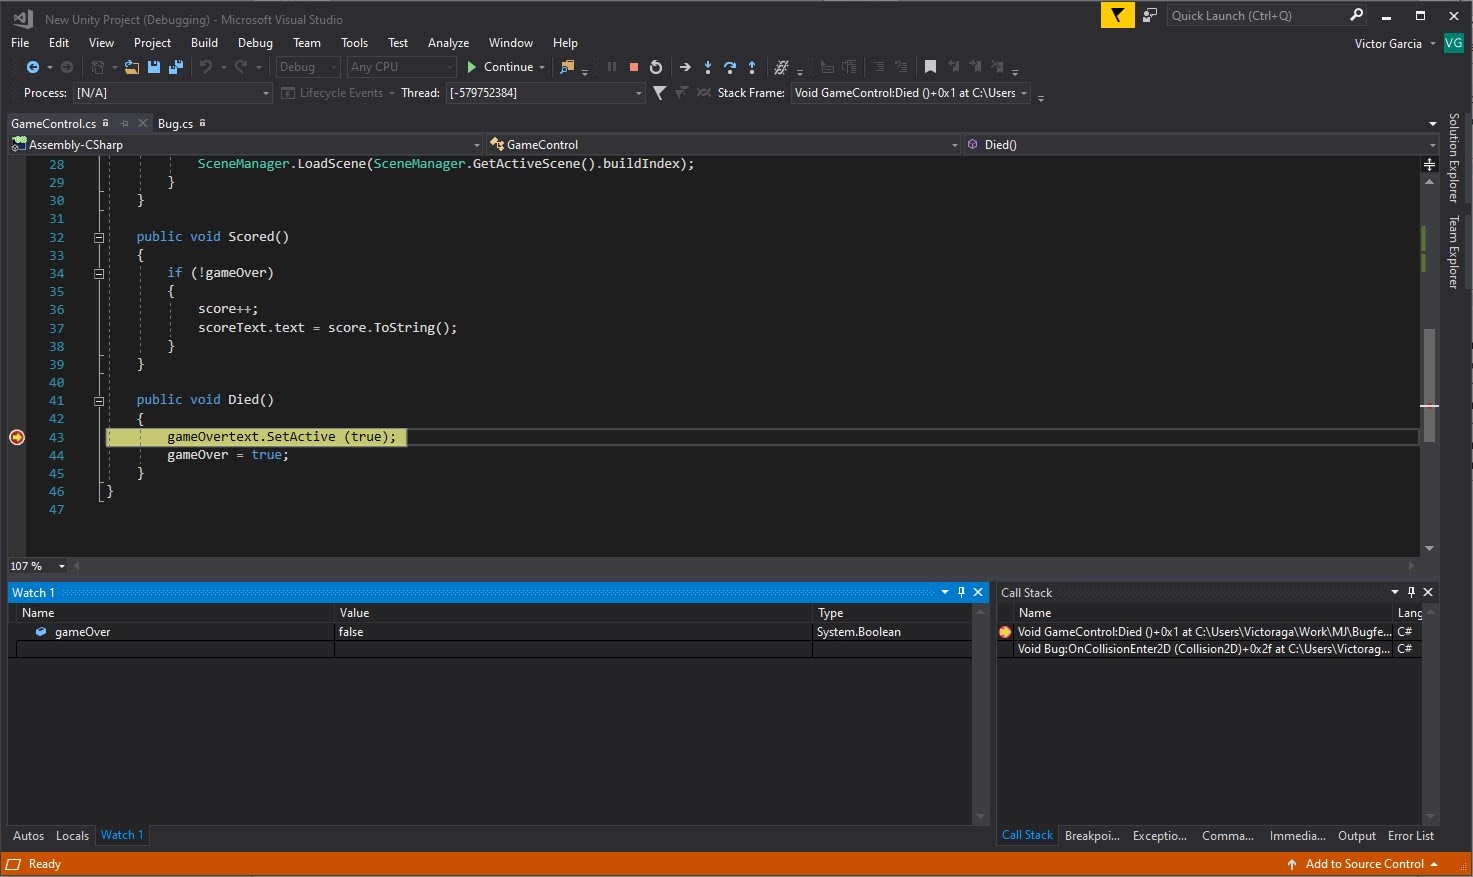
Where the execution has been interrupted, we can check that the Attach to Unity button now says Continue. This is the button we must press to resume the game execution.
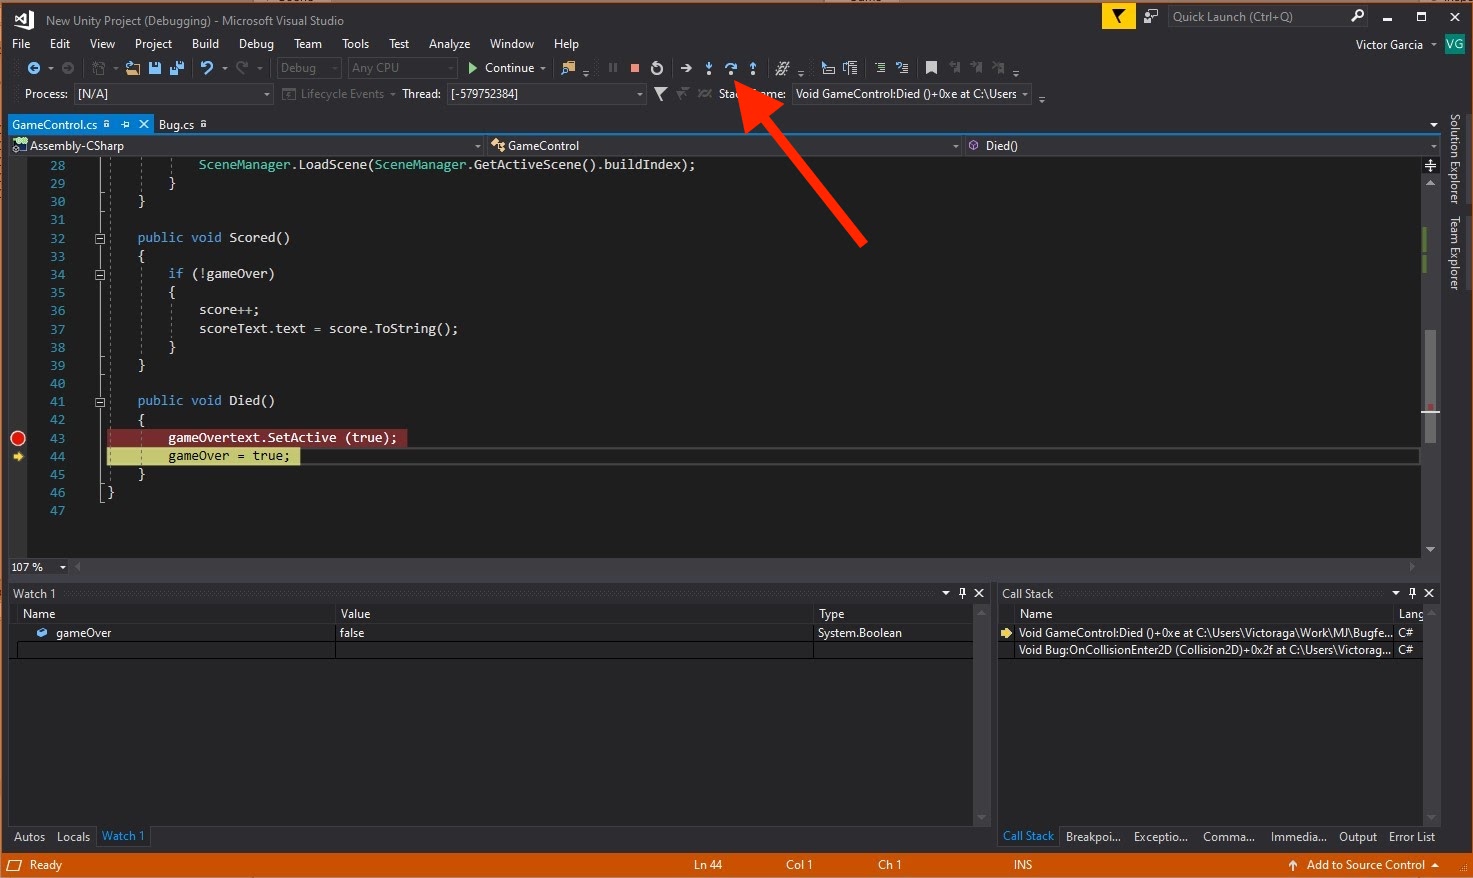
But before resuming the execution let’s take a look at the lower panels. In the left-hand panel we can now see the variables that are in the scope of the breakpoint and even check its value. In the right-hand panel we can see the stack trace of the functions that brought us to this breakpoint. Finally, instead of continuing, we can use the step by step and the step over buttons (the arrows to the right of the Continue button in the screen).
This button allow us to move only one line forward or to the next function without resuming the execution.
We cannot add more code in Visual Studio until we finish the debugging session. That can be done simply by pressing the Stop button.
You can find more Information about the Unity debugger in the official docs.
How to debug a game in production using Bugfender
Logs and breakpoints are perfect to debug our game in our computer. However, when the game is sent to production and users start to complain, this might be not enough.
Most of the users have no technical skills, so we will often receive bug reports like “it doesn’t work” or “it crashes”. Our recommended strategy is to contact those users and ask them to fill out a bug report template, or just ask them a few questions that might look obvious to you as a game developer but that are not obvious to the users:
- What were you doing when the game stopped working?
- What do you mean by “stopped working”? Does it mean you can’t control the game anymore? Does it mean the app was suddenly closed?
- Could you describe a list of the steps by which the app reaches this unstable state where you can’t play anymore?
In an ideal world, we would visit the home of our users to see the problem with our own eyes and if necessary, we would execute the Unity debugger on their computers to find the exact problem with the code. We can’t do that – but we can use Bugfender, which is going to behave in a very similar way.
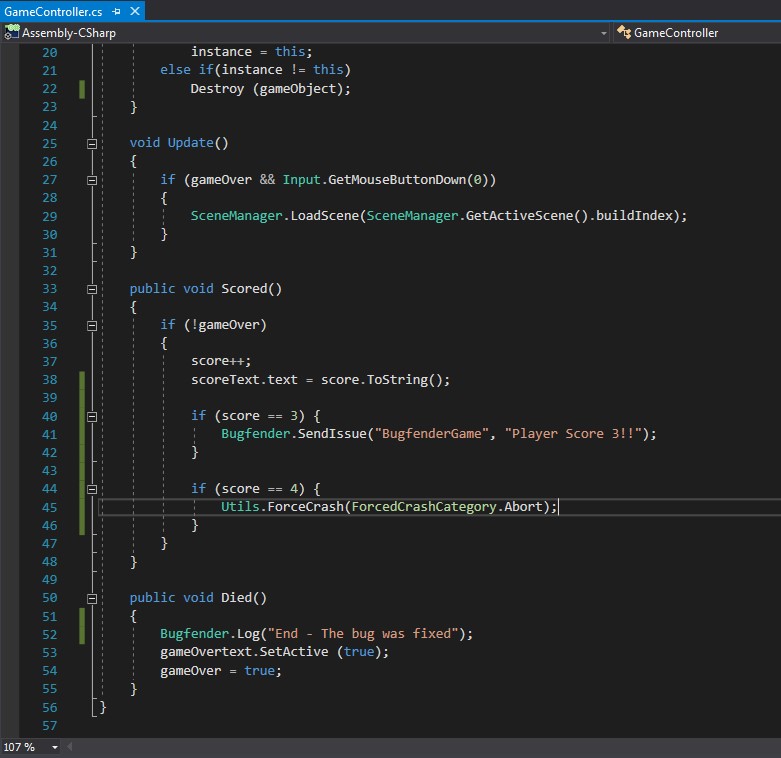
Bugfender is a remote logger that allows you to revisit the console logs for a specific device. The only two things we need to do is add Bugfender to the Unity project and replace the calls to Debug.Log() with Bugfender.Log(). Then, when we receive a bug report from a user we can just go to the Bugfender console and check exactly what happened.
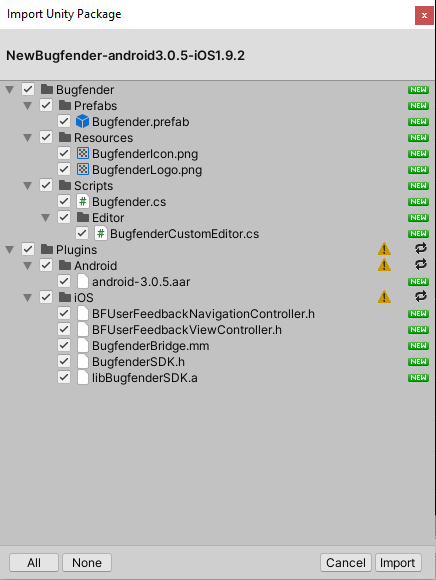
1. Add Bugfender to your project
Installing the Bugfender SDK in your project will take you just two minutes.
- Download and import this assets package into your project.
- Drag the package to Unity to import it.
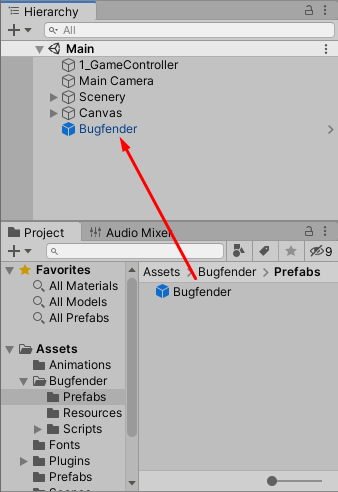
3. Drag the Bugfender package from the Assets\Bugfender\Prefabs to the Hierarchy panel
- If you don’t have a Bugfender account you can get one for free here.
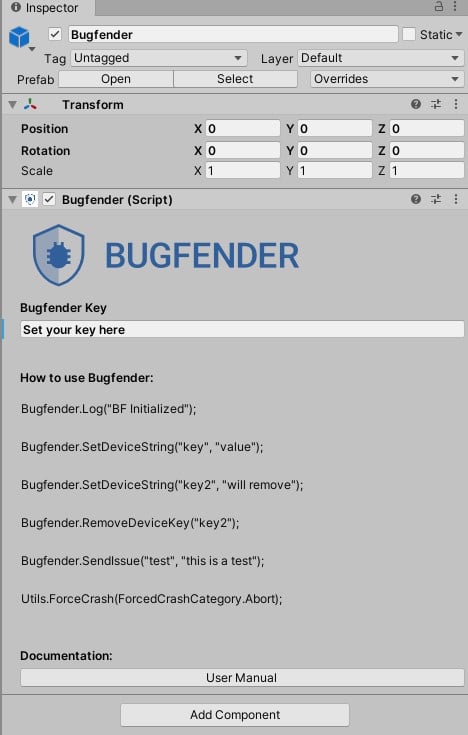
- Go back to Unity, select the Bugfender GameObject in the hierarchy panel and set the Bugfender app key in the Inspector panel.
Even if your game has several scenes, you only need to add Bugfender once, as we did in the last step.
6. Now you can use Bugfender.Log() to send logs to Bugfender.
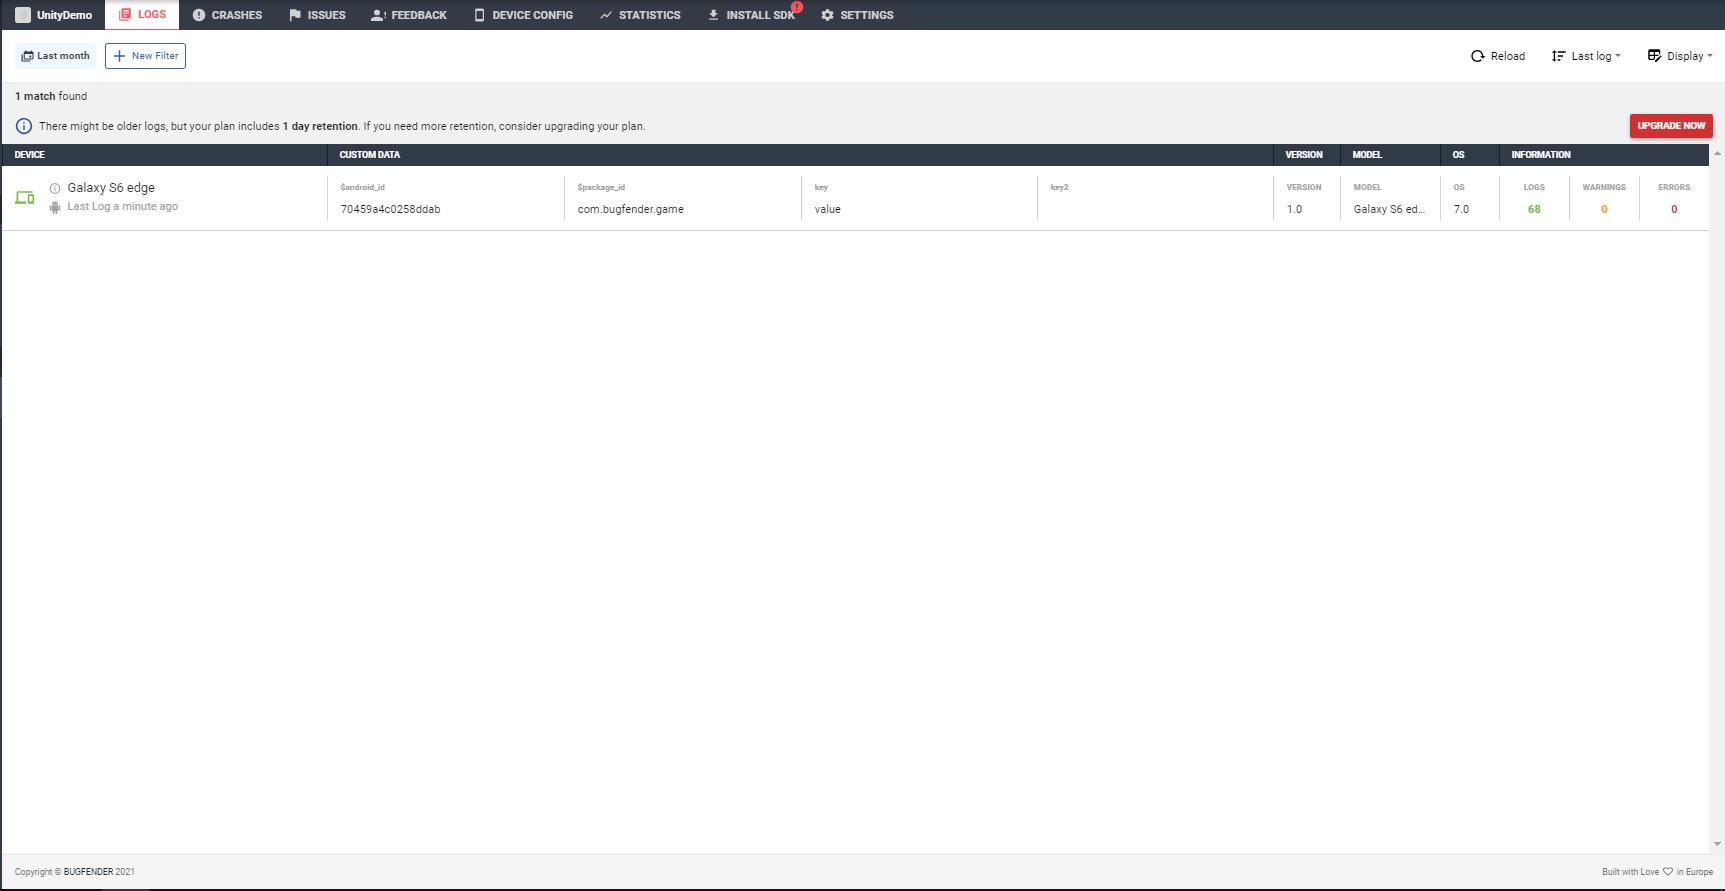
- Run the game and ensure the code reaches the spot where you placed the log line. Log into the Bugfender console and after a few seconds a new device should show up in the devices list.
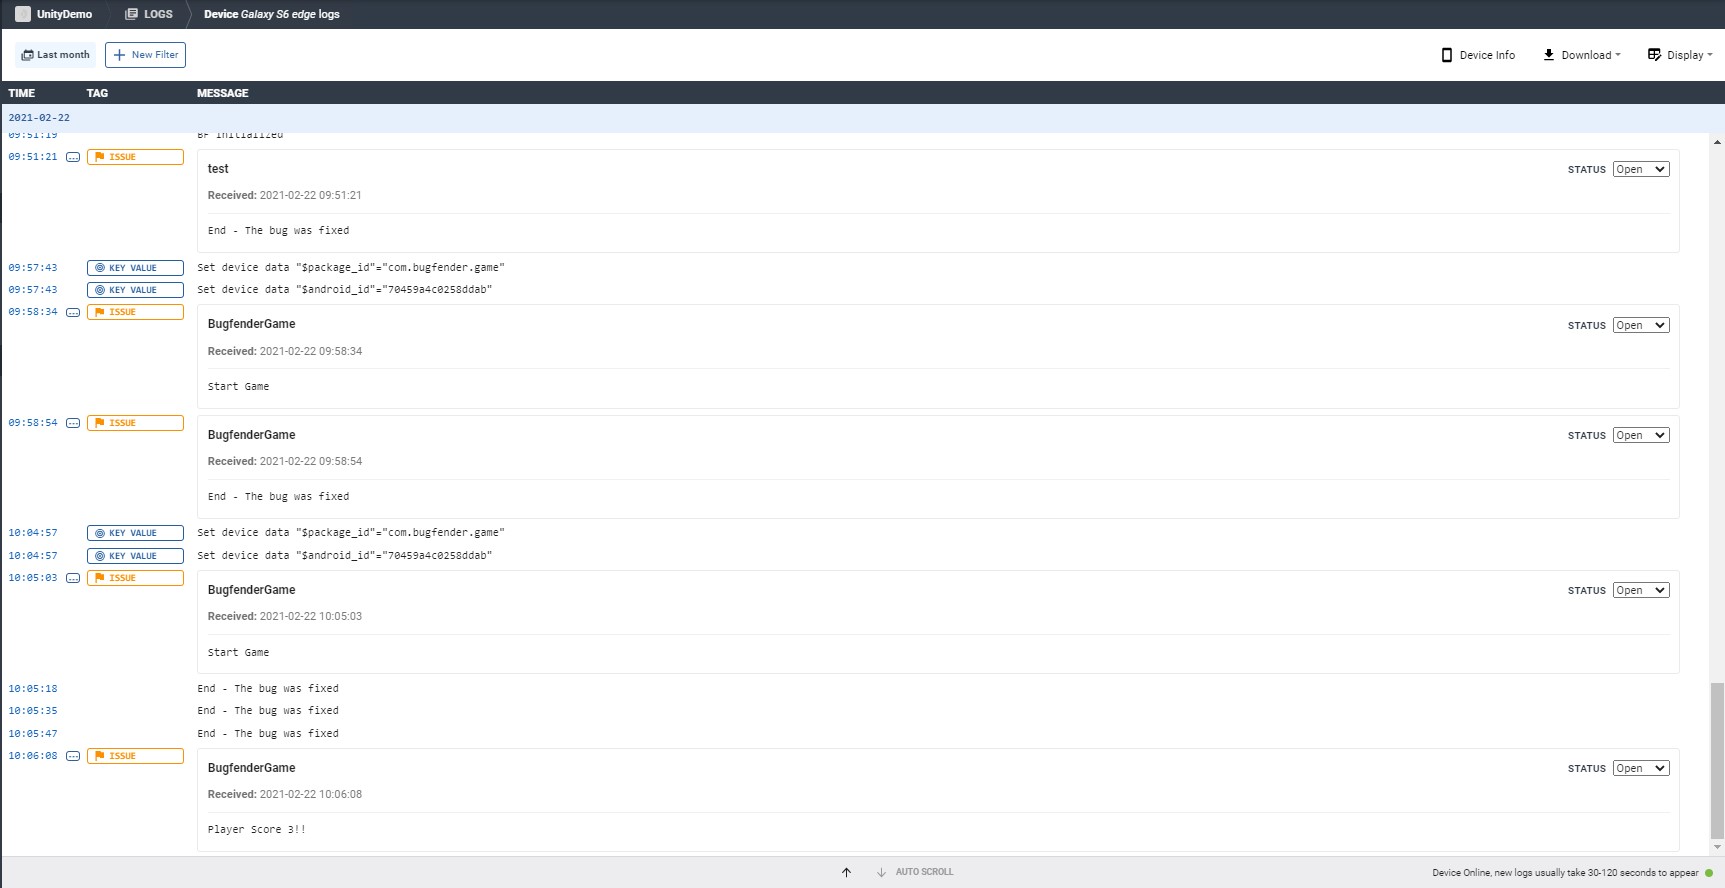
8. If you click on the device then you will be able to see the console logs for the device that you’ve sent to Bugfender using Bugfender.log().
Congratulations! Now you’ve completed the circle and you can debug your games locally, both while you’re developing them and later on in production, when your users are already playing them. That’s all for this tutorial, but remember that we’ve only scratched the surface of Bugfender’s capabilities.
Bugfender can also help you to detect crashes, get user feedback, provide live customer service and create automated actions… really, the list is endless.
We suggest you visit our blog from time to time, because we regularly publish engineering-related content. If you would like to read more Unity-related tutorials or you have any specific doubts, feel free to reach us at [email protected], through our customer service channels or via Github. We have also an extensive section of documents on our website that offer plenty more useful information about Bugfender.
Happy debugging!